Download
1 / 39
390 likes | 551 Views
QTL Mapping in Heterogeneous Stocks. Talbot et al , Nature Genetics (1999) 21:305-308 Mott et at, PNAS (2000) 97:12649-12654. QTL Detection in F2 to get 30cM resolution. Chromosome 1. Chromosome 15. Chromosome 10. Gershenfeld et al Behav Genetics, 1997. Heterogeneous Stocks (HS).

E N D
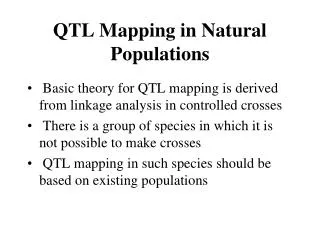
QTL Mapping in Heterogeneous Stocks • Talbot et al , Nature Genetics (1999) 21:305-308 • Mott et at, PNAS (2000) 97:12649-12654
QTL Detection in F2 to get 30cM resolution Chromosome 1 Chromosome 15 Chromosome 10 Gershenfeld et al Behav Genetics, 1997
Heterogeneous Stocks (HS) • A murine cross formed from 8 inbred founders • Randomly outbred for >60 generations, • 40 mating pairs per generation • Each chromosome is a random mosaic of the founders • Average distance between recombinants is 1/60=1.7cM
Fine Mapping with HS QTL Mosaic of progenitor strains Region Scan with microsatellites or SNPs. Test for association between marker and trait by ANOVA
Mapping by Single-Marker Association Look for association between the phenotype andeach marker in the genome scan: • A markerm has alleles 1…k • Assume phenotypic effect for allele a is Vma • phenotype for individual with genotype a,b is Vma + Vmb • Estimate Vma ‘s by analysis of variance • Conclude QTL linked to markerm if some Vma are significantly different
Single-marker QTL mapping • Genotype and phenotype ~750 HS mice over 5 regions where QTL detection indicated the presence of a QTL • Test for the association between the phenotype and marker allele as with F2 cross • Two QTL fine-mapped to <1cM
Failures Chromosome 15 Chromosome 10
Single-Marker Analysis Can Fail Only 2/5 QTL detected in the F2 cross wereconfirmed by SM in the HS mice. Why ? • Genetic Drift eliminated some of the QTL. Simulations indicate this is unlikely.
Single-Marker Analysis Can Fail Only 2/5 QTL detected in the F2 cross wereconfirmed by SM in the HS mice. Why ? • Chromosomes with the same marker allele may be descended from different strains, and so have different trait effects.
Wrong Phase, No Effect QTL Marker 1: No effect observable Marker 2: Observable effect
Single-Marker Analysis Can Fail Only 2/5 QTL detected in the F2 cross wereconfirmed by SM in the HS mice. Why ? • Chromosomes with the same marker allele may be descended from different strains, and so have different trait effects. • Need to test for association between trait and strain rather than trait and marker
Fine Mapping with HS QTL Mosaic of progenitor strains – Hidden Data Region Scan with microsatellites or SNPs. Observed Genotypes Loss of information because #alleles < #strains & phase unknown Must infer progenitors from genotypes and test for presence of QTL in each interval
marker D1MIT498 5 alleles position 64.000 A/J AKR BALB C3H C57 DBA I RIII allele ND 0.125 0.125 0.125 0.125 0.125 0.125 0.125 0.125 allele 132 0.500 0.000 0.000 0.500 0.000 0.000 0.000 0.000 allele 155 0.000 1.000 0.000 0.000 0.000 0.000 0.000 0.000 allele 153 0.000 0.000 0.250 0.000 0.250 0.250 0.250 0.000 allele 130 0.000 0.000 0.000 0.000 0.000 0.000 0.000 1.000
HS Interval Mapping dm cdm m m+1 s s’ t t’ Pmi(s,t) Qm+1,i(s’,t’) QTL
Summary(1) • Heterogeneous Stocks provide an experimental means for fine-mapping QTL of small effect • Dynamic Programming provides a powerful statistical means for analysing HS data • 5/5 QTL for behaviour were detected and fine-mapped • Mott et al (2000) PNAS97:12649-12654
HAPPY web resources HAPPY is a program to map QTLs in Heterogeneous Stocks HAPPY home page: http://www.well.ox.ac.uk/happy Web Server: http://zeno.well.ox.ac.uk:8080/git-bin/happy.cgi
Future Directions (1)Mapping Traits in Parallel • We propose to genotype 3000 markers 1cM apart on 2000 HS mice • Measure as many phenotypes as possible affecting asthma, diabetes, behaviour etc on these animals • Map all genes affecting these traits in parallel • Much cheaper than scanning diseases separately • Simulations indicate >90% probability of detecting any gene accounting for >2.5% of phenotypic variance at genome-wide 5% significance level
Future Directions(2)Mapping Modifier Genes • Over 2500 mouse models transgenic for human • On inbred or backcross background • HS x transgenic hybrid can be used for mapping modifiers • Need to extend analysis for F2 HS x inbred
Inbred-Outbred Cross • Detection phase – a genome scan with ~100 markers at 20-30 cM seperation • Fine-Mapping Phase – rescan at 1cM spacing only those regions which were detected
Simultaneous Detection And Fine Mapping Using an Inbred Outbred Cross Fine Map using HS chromosome x Genome Scan using F2 chromosome Inbred strain (knockout) HS Mouse F2
Inbred-Outbred Analysis • QTL detection depends on variance between HS and background • Fine-mapping depends on variance within HS • Power depends on how total variance is split between the detection and fine-map • phases
Variance under Dominance Model full HS difference detection Proportion of HS carrying modifier
Simulation Results for the Inbred Outbred Design • QTL explaining 10% of phenotypic variance • 1,500 animals, 500 simulations • 5 markers per 100 cm detection phase • Markers at 1 cm interval for fine-mapping • (We haven’t explored all parameters yet)
Summary(2) • Mapping in a genetically heterogeneous stock of known ancestry can achieve sub-centimorgan resolution • Theoretically, crosses between inbreds and outbreds can detect and fine-map a genetic effect in one experiment
Chris Talbot Al Collins Jeanne Wehner John DeFries Acknowledgements Wellcome Trust Centre for Human Genetics, Oxford Institute for Behavioral Genetics, Boulder