
Descriptive Statistics
Descriptive Statistics. Four different scales for presenting info. Nominal : Give something a name ex: 1: Male, 2: Female Ordinal : Put in order, but not equal distance between steps ex: ranking of state population Interval : Ordinal, but equal steps ex: days of the week

Descriptive Statistics
E N D
Presentation Transcript
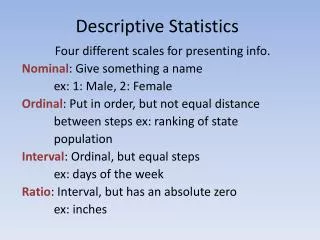
Descriptive Statistics Four different scales for presenting info. Nominal: Give something a name ex: 1: Male, 2: Female Ordinal: Put in order, but not equal distance between steps ex: ranking of state population Interval: Ordinal, but equal steps ex: days of the week Ratio: Interval, but has an absolute zero ex: inches
Central Tendency Mode: most frequent score can have multiple modes, use in nominal data Median: middle score use when there are uncommon extremes ex: salary Mean: average score be careful when using ex: Aggies crossed the river that averages 2 ft. deep and drowned
Measures of Dispersion Range (highest score – lowest score) Semi-interquartile range: (Q3-Q1)/2 (75%-25%)/2 Standard Deviation: how much the scores deviate from the mean
Calculate Standard Deviation Set of numbers Find the mean (x-mean)2 Find the sum of all numbers, divide by number of original units, then find the square root Source: Wikipedia.com


