Download

1 / 25
0 likes | 12 Views
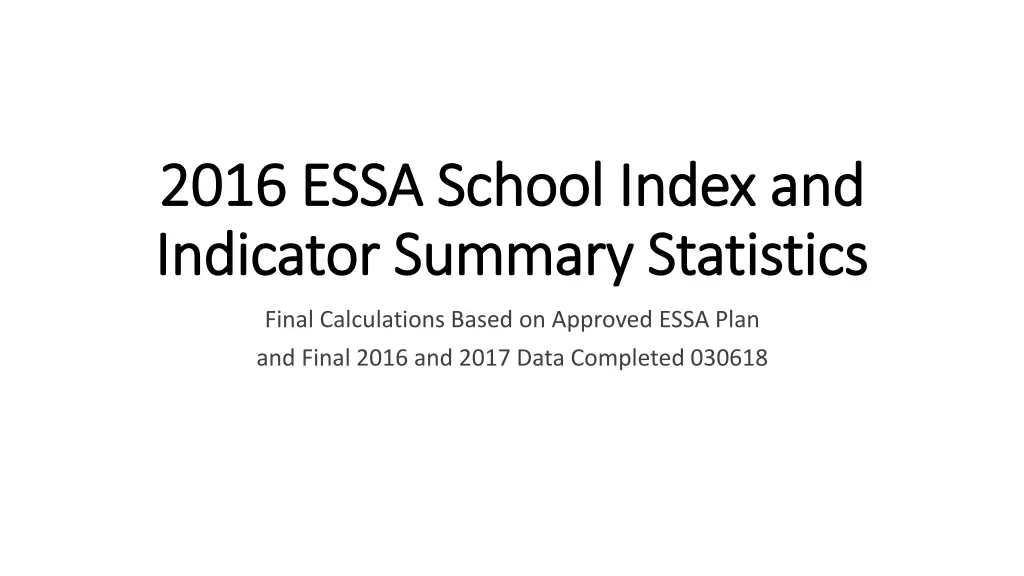
Final calculations based on the approved ESSA plan and 2016-2017 data show statistical markers and distributions for school index scores, weighted achievement, school value-added growth, and graduation rates across elementary, middle, and high school levels.

E N D
2016 2016 ESSA School Index and ESSA School Index and Indicator Summary Indicator Summary Statistics Statistics Final Calculations Based on Approved ESSA Plan and Final 2016 and 2017 Data Completed 030618
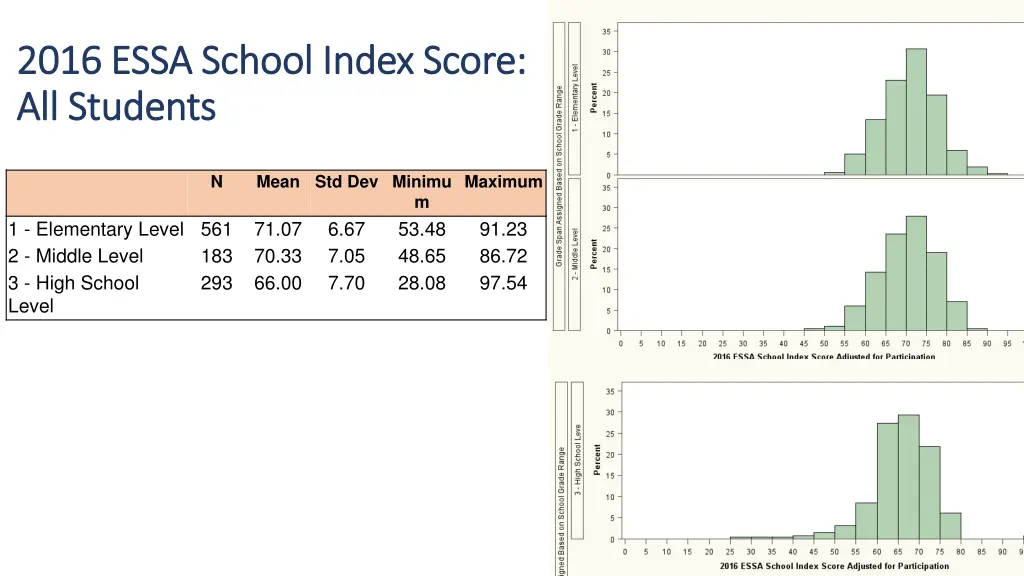
2016 ESSA School Index Score: 2016 ESSA School Index Score: All Students All Students N Mean Std Dev Minimu Maximum m 1 - Elementary Level 561 2 - Middle Level 3 - High School Level 71.07 70.33 66.00 6.67 7.05 7.70 53.48 48.65 28.08 91.23 86.72 97.54 183 293
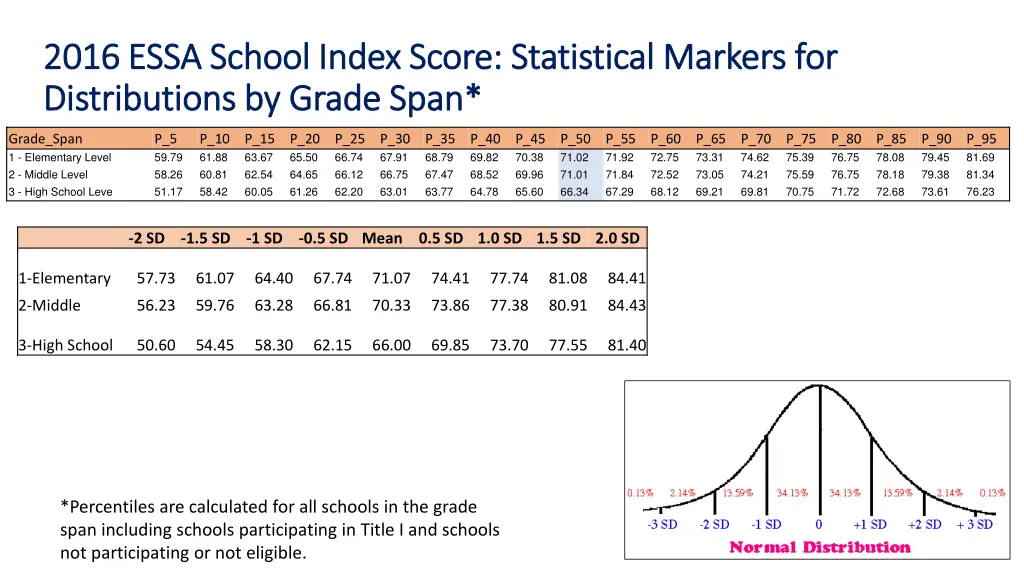
2016 ESSA 2016 ESSA School Index Score: School Index Score: Statistical Markers for Distributions by Grade Span* Distributions by Grade Span* Statistical Markers for Grade_Span 1 - Elementary Level 2 - Middle Level 3 - High School Leve P_5 59.79 58.26 51.17 P_10 61.88 60.81 58.42 P_15 63.67 62.54 60.05 P_20 65.50 64.65 61.26 P_25 66.74 66.12 62.20 P_30 67.91 66.75 63.01 P_35 68.79 67.47 63.77 P_40 69.82 68.52 64.78 P_45 70.38 69.96 65.60 P_50 71.02 71.01 66.34 P_55 71.92 71.84 67.29 P_60 72.75 72.52 68.12 P_65 73.31 73.05 69.21 P_70 74.62 74.21 69.81 P_75 75.39 75.59 70.75 P_80 76.75 76.75 71.72 P_85 78.08 78.18 72.68 P_90 79.45 79.38 73.61 P_95 81.69 81.34 76.23 -2 SD -1.5 SD -1 SD -0.5 SD Mean 0.5 SD 1.0 SD 1.5 SD 2.0 SD 1-Elementary 57.73 61.07 64.40 67.74 71.07 74.41 77.74 81.08 84.41 2-Middle 56.23 59.76 63.28 66.81 70.33 73.86 77.38 80.91 84.43 3-High School 50.60 54.45 58.30 62.15 66.00 69.85 73.70 77.55 81.40 *Percentiles are calculated for all schools in the grade span including schools participating in Title I and schools not participating or not eligible.
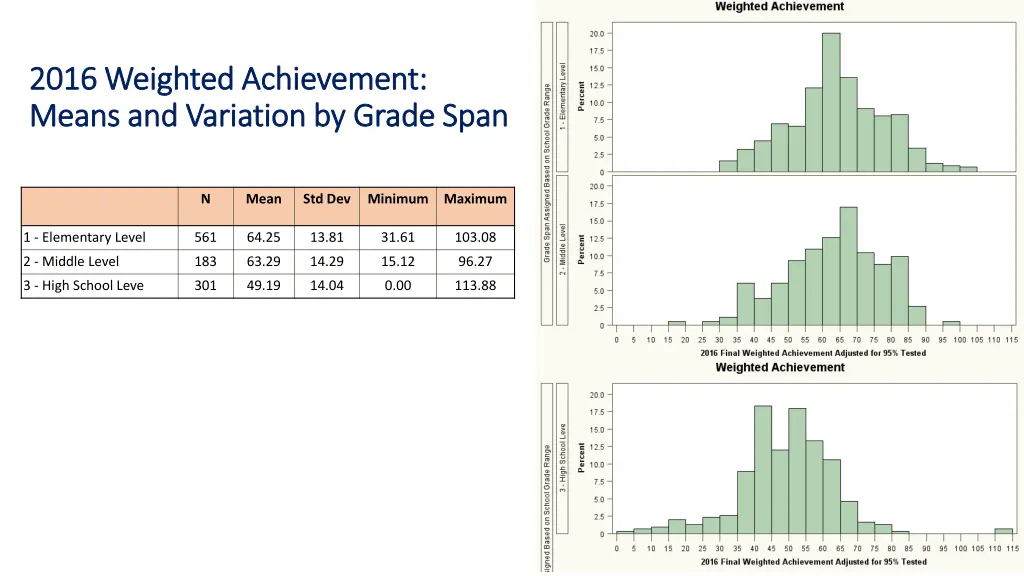
2016 Weighted Achievement: 2016 Weighted Achievement: Means and Variation by Grade Span Means and Variation by Grade Span N Mean Std Dev Minimum Maximum 1 - Elementary Level 561 64.25 13.81 31.61 103.08 2 - Middle Level 183 63.29 14.29 15.12 96.27 3 - High School Leve 301 49.19 14.04 0.00 113.88
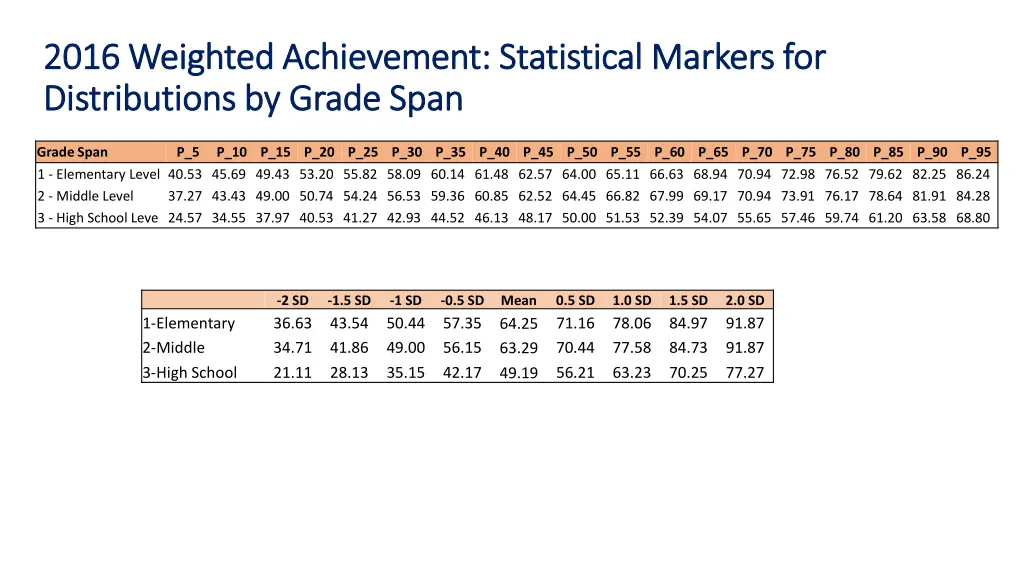
2016 Weighted Achievement: Statistical Markers for 2016 Weighted Achievement: Statistical Markers for Distributions by Grade Span Distributions by Grade Span Grade Span 1 - Elementary Level 40.53 45.69 49.43 53.20 55.82 58.09 60.14 61.48 62.57 64.00 65.11 66.63 68.94 70.94 72.98 76.52 79.62 82.25 86.24 2 - Middle Level 37.27 43.43 49.00 50.74 54.24 56.53 59.36 60.85 62.52 64.45 66.82 67.99 69.17 70.94 73.91 76.17 78.64 81.91 84.28 3 - High School Leve 24.57 34.55 37.97 40.53 41.27 42.93 44.52 46.13 48.17 50.00 51.53 52.39 54.07 55.65 57.46 59.74 61.20 63.58 68.80 P_5 P_10 P_15 P_20 P_25 P_30 P_35 P_40 P_45 P_50 P_55 P_60 P_65 P_70 P_75 P_80 P_85 P_90 P_95 -2 SD 36.63 34.71 21.11 -1.5 SD 43.54 41.86 28.13 -1 SD 50.44 49.00 35.15 -0.5 SD 57.35 56.15 42.17 Mean 64.25 63.29 49.19 0.5 SD 71.16 70.44 56.21 1.0 SD 78.06 77.58 63.23 1.5 SD 84.97 84.73 70.25 2.0 SD 91.87 91.87 77.27 1-Elementary 2-Middle 3-High School
2016 School Value 2016 School Value- -Added Growth: Means and Growth: Means and Variation by Grade Span Variation by Grade Span Added N Mean Std Dev Minimum Maximum 79.86 2.69 71.25 80.28 2.76 70.94 80.17 3.28 69.57 1 - Elementary Level 561 2 - Middle Level 3 - High School Leve 301 87.83 87.64 90.18 183
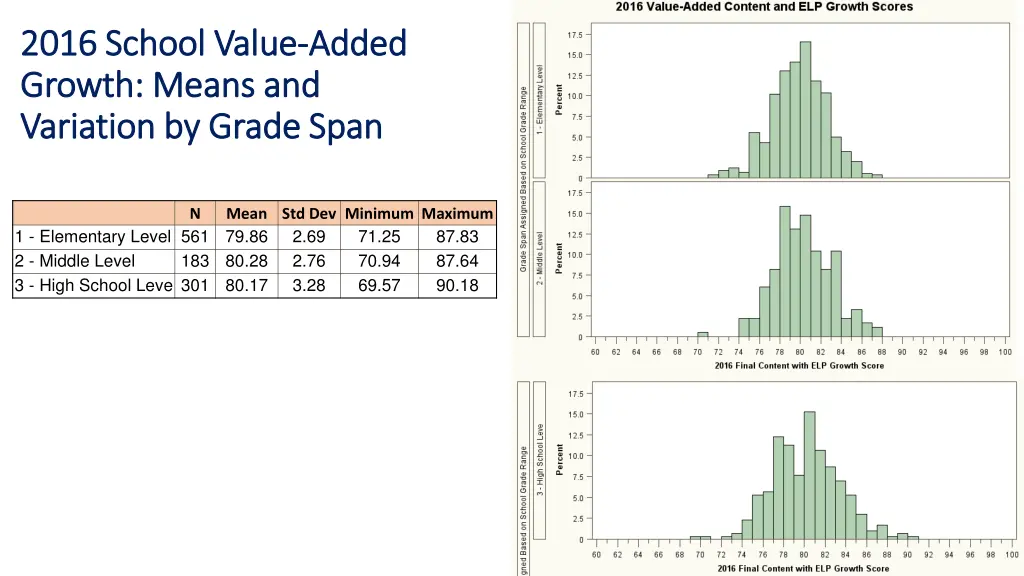
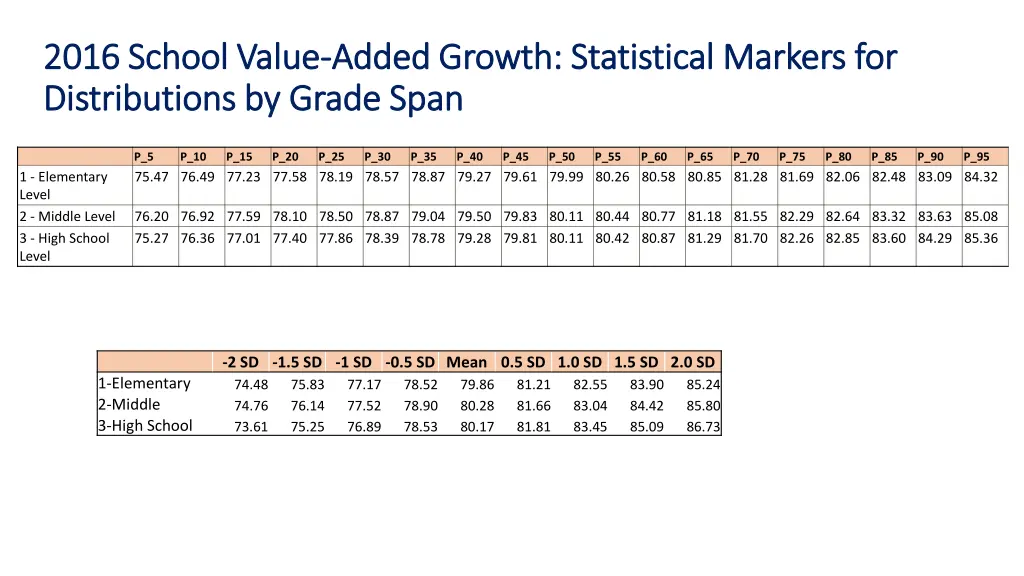
2016 School Value 2016 School Value- -Added Growth: Statistical Markers for Added Growth: Statistical Markers for Distributions by Grade Span Distributions by Grade Span P_5 75.47 76.49 77.23 77.58 78.19 78.57 78.87 79.27 79.61 79.99 80.26 80.58 80.85 81.28 81.69 82.06 82.48 83.09 84.32 P_10 P_15 P_20 P_25 P_30 P_35 P_40 P_45 P_50 P_55 P_60 P_65 P_70 P_75 P_80 P_85 P_90 P_95 1 - Elementary Level 2 - Middle Level 3 - High School Level 76.20 76.92 77.59 78.10 78.50 78.87 79.04 79.50 79.83 80.11 80.44 80.77 81.18 81.55 82.29 82.64 83.32 83.63 85.08 75.27 76.36 77.01 77.40 77.86 78.39 78.78 79.28 79.81 80.11 80.42 80.87 81.29 81.70 82.26 82.85 83.60 84.29 85.36 -2 SD -1.5 SD -1 SD -0.5 SD Mean 0.5 SD 1.0 SD 1.5 SD 2.0 SD 74.48 75.83 77.17 78.52 79.86 74.76 76.14 77.52 78.90 80.28 73.61 75.25 76.89 78.53 80.17 1-Elementary 2-Middle 3-High School 81.21 81.66 81.81 82.55 83.04 83.45 83.90 84.42 85.09 85.24 85.80 86.73
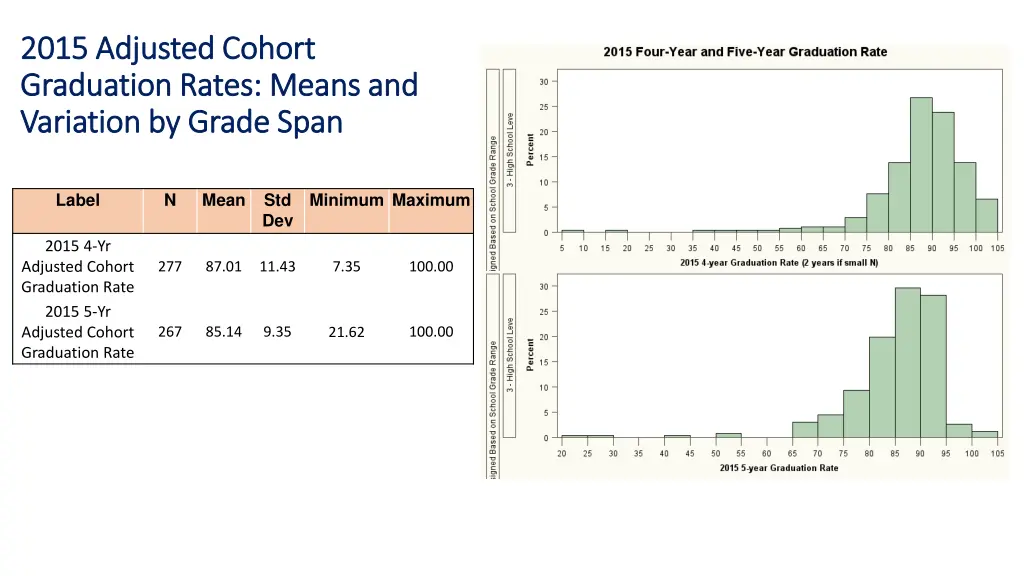
2015 Adjusted Cohort 2015 Adjusted Cohort Graduation Rates: Means and Graduation Rates: Means and Variation by Grade Span Variation by Grade Span Label N Mean Std Dev Minimum Maximum 2015 4-Yr Adjusted Cohort Graduation Rate 2015 5-Yr Adjusted Cohort Graduation Rate 277 87.01 11.43 7.35 100.00 267 85.14 9.35 100.00 21.62
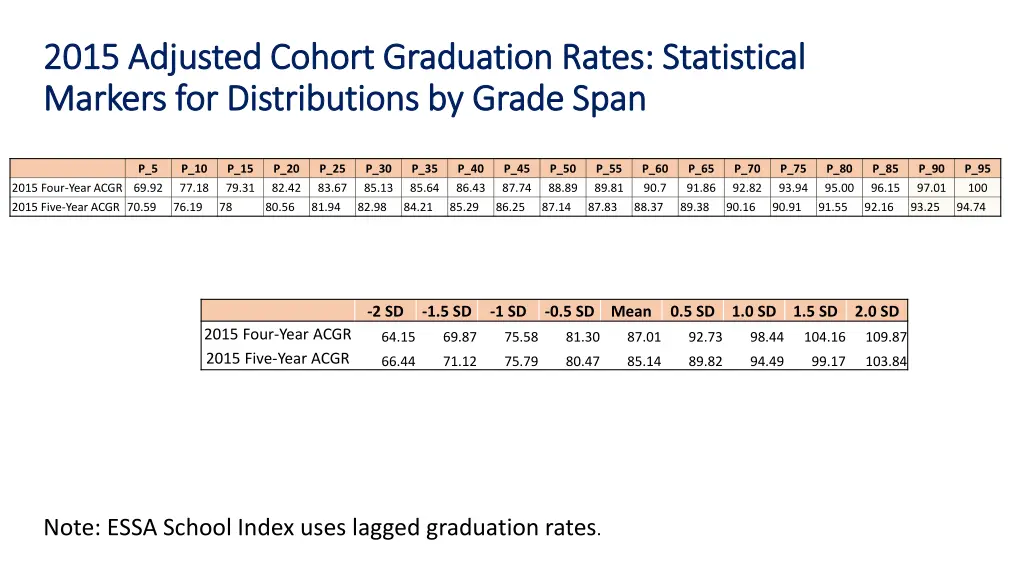
2015 Adjusted 2015 Adjusted Cohort Graduation Cohort Graduation Rates: Statistical Markers for Distributions by Grade Span Markers for Distributions by Grade Span Rates: Statistical P_5 P_10 77.18 P_15 79.31 P_20 82.42 P_25 83.67 P_30 85.13 P_35 85.64 P_40 86.43 P_45 87.74 P_50 88.89 P_55 89.81 P_60 90.7 P_65 91.86 P_70 92.82 P_75 93.94 P_80 95.00 P_85 96.15 P_90 97.01 P_95 100 2015 Four-YearACGR 69.92 2015 Five-Year ACGR 70.59 76.19 78 80.56 81.94 82.98 84.21 85.29 86.25 87.14 87.83 88.37 89.38 90.16 90.91 91.55 92.16 93.25 94.74 -2 SD -1.5 SD -1 SD -0.5 SD Mean 0.5 SD 1.0 SD 1.5 SD 2.0 SD 2015 Four-Year ACGR 2015 Five-Year ACGR 64.15 69.87 75.58 81.30 87.01 92.73 98.44 104.16 109.87 66.44 71.12 75.79 80.47 85.14 89.82 94.49 99.17 103.84 Note: ESSA School Index uses lagged graduation rates.
2016 School Quality Student 2016 School Quality Student Success (SQSS): Means and Success (SQSS): Means and Variation by Grade Span Variation by Grade Span Grade Span N Mean Std Dev Minimum Maximum 1 - Elementary Level 2 - Middle Level 3 - High School Leve 561 183 301 57.66 53.58 51.77 9.66 8.21 8.77 31.70 32.65 4.59 100.00 71.95 84.06
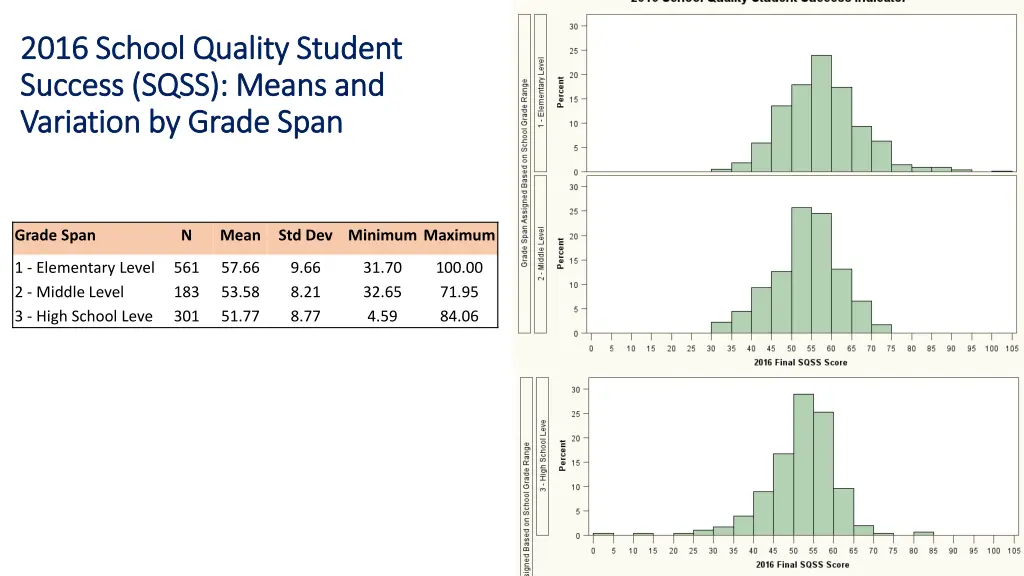
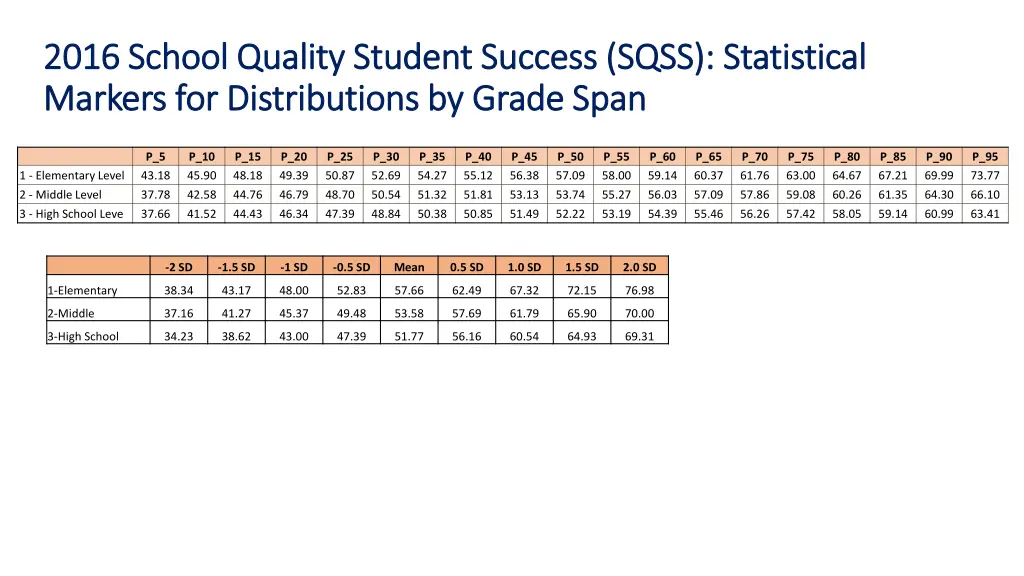
2016 School 2016 School Quality Student Success (SQSS) Quality Student Success (SQSS): Statistical Markers for Distributions by Grade Span Markers for Distributions by Grade Span : Statistical P_5 43.18 P_10 45.90 P_15 48.18 P_20 49.39 P_25 50.87 P_30 52.69 P_35 54.27 P_40 55.12 P_45 56.38 P_50 57.09 P_55 58.00 P_60 59.14 P_65 60.37 P_70 61.76 P_75 63.00 P_80 64.67 P_85 67.21 P_90 69.99 P_95 73.77 1 - Elementary Level 2 - Middle Level 37.78 42.58 44.76 46.79 48.70 50.54 51.32 51.81 53.13 53.74 55.27 56.03 57.09 57.86 59.08 60.26 61.35 64.30 66.10 3 - High School Leve 37.66 41.52 44.43 46.34 47.39 48.84 50.38 50.85 51.49 52.22 53.19 54.39 55.46 56.26 57.42 58.05 59.14 60.99 63.41 -2 SD -1.5 SD -1 SD -0.5 SD Mean 0.5 SD 1.0 SD 1.5 SD 2.0 SD 1-Elementary 38.34 43.17 48.00 52.83 57.66 62.49 67.32 72.15 76.98 2-Middle 37.16 41.27 45.37 49.48 53.58 57.69 61.79 65.90 70.00 3-High School 34.23 38.62 43.00 47.39 51.77 56.16 60.54 64.93 69.31
Components of School Quality Components of School Quality Student Success Indicator Student Success Indicator
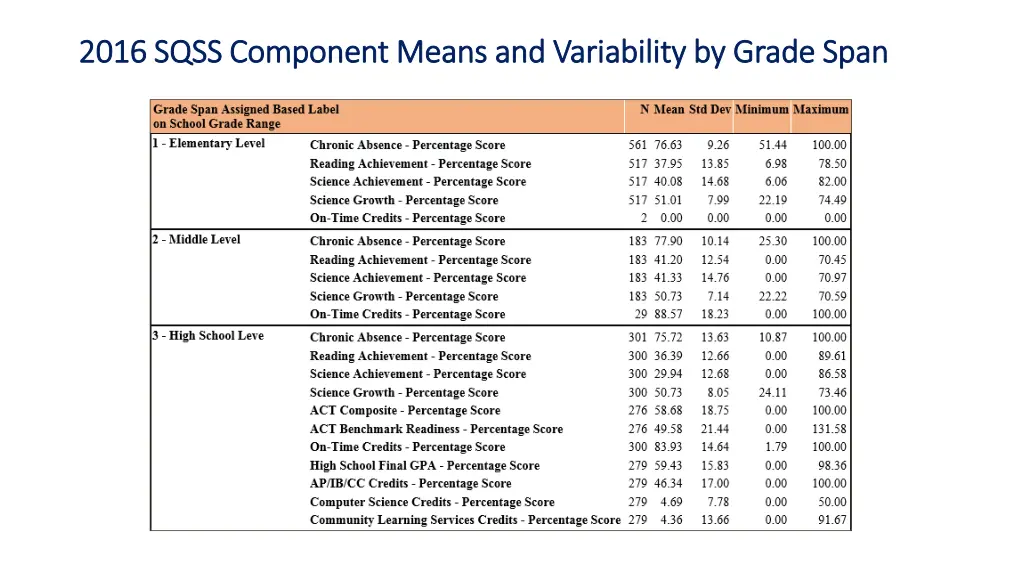
2016 SQSS Component Means 2016 SQSS Component Means and Variability by Grade Span and Variability by Grade Span
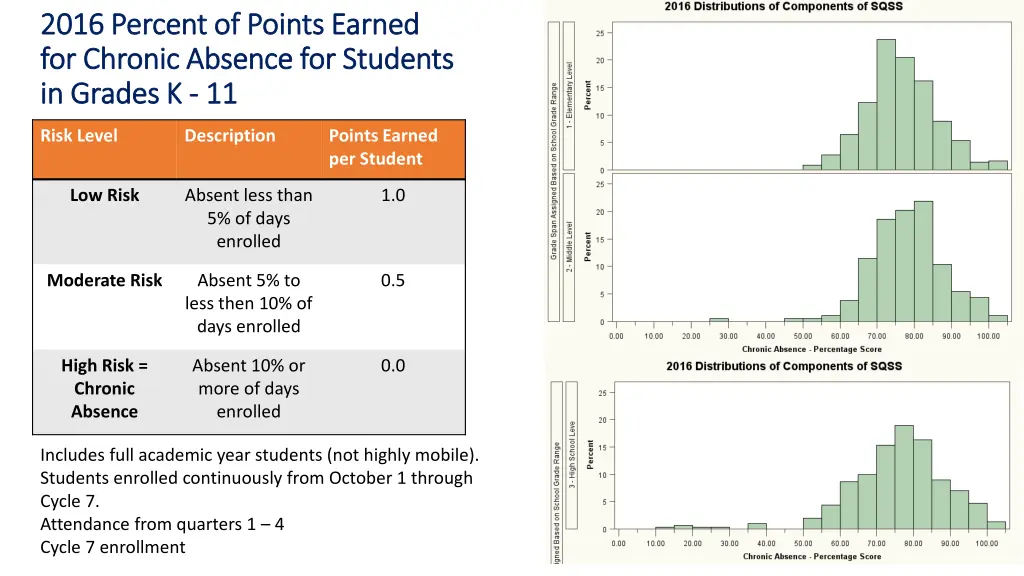
2016 Percent of Points Earned 2016 Percent of Points Earned for Chronic Absence for Students for Chronic Absence for Students in Grades K in Grades K - - 11 11 Risk Level Description Points Earned per Student Low Risk Absent less than 5% of days enrolled 1.0 Moderate Risk Absent 5% to less then 10% of days enrolled 0.5 High Risk = Chronic Absence Absent 10% or more of days enrolled 0.0 Includes full academic year students (not highly mobile). Students enrolled continuously from October 1 through Cycle 7. Attendance from quarters 1 – 4 Cycle 7 enrollment
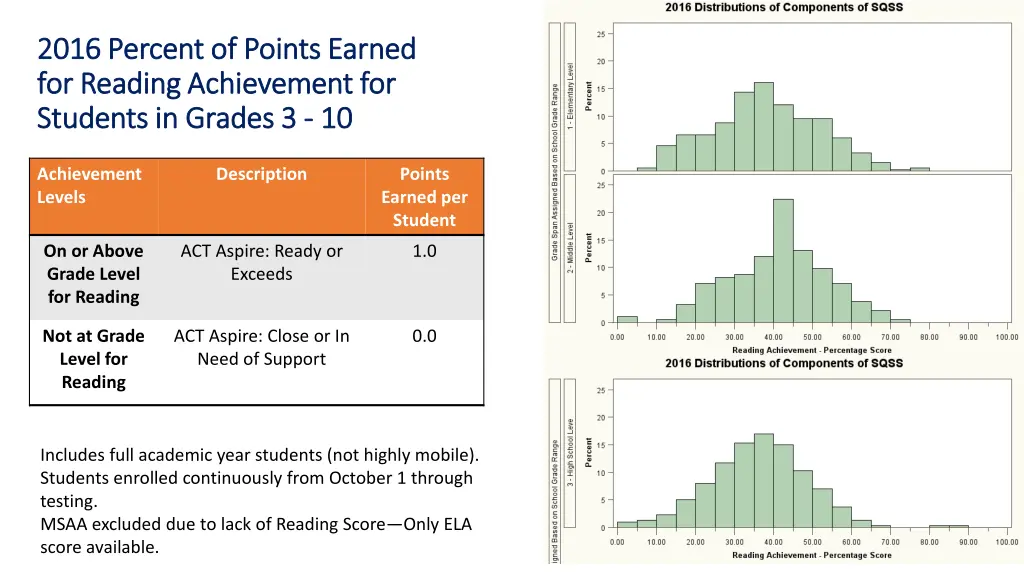
2016 Percent of Points Earned 2016 Percent of Points Earned for Reading Achievement for for Reading Achievement for Students in Grades 3 Students in Grades 3 - - 10 10 Achievement Levels Description Points Earned per Student On or Above Grade Level for Reading ACT Aspire: Ready or Exceeds 1.0 Not at Grade Level for Reading ACT Aspire: Close or In Need of Support 0.0 Includes full academic year students (not highly mobile). Students enrolled continuously from October 1 through testing. MSAA excluded due to lack of Reading Score—Only ELA score available.
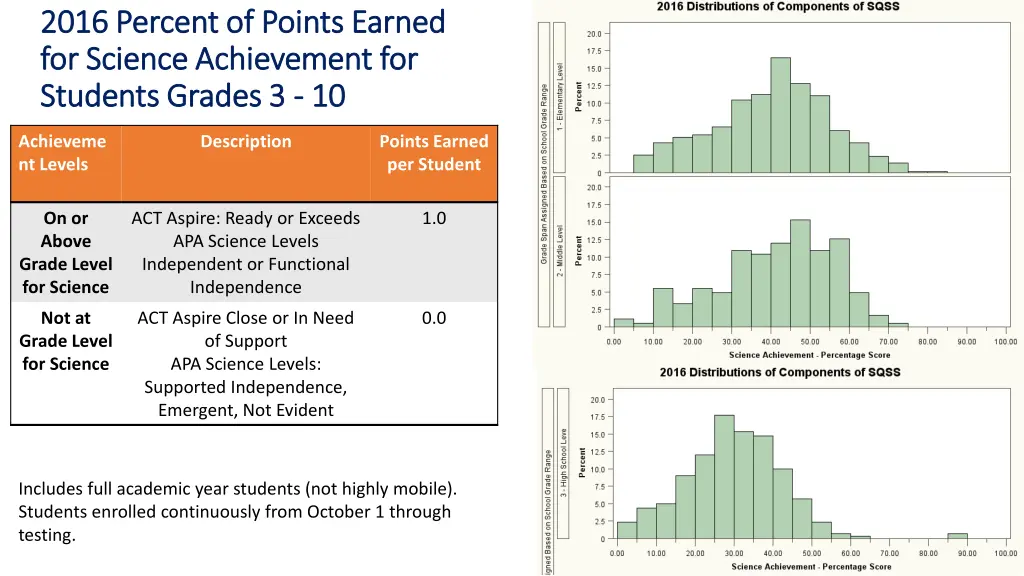
2016 Percent of Points Earned 2016 Percent of Points Earned for Science Achievement for for Science Achievement for Students Grades 3 Students Grades 3 - - 10 10 Achieveme nt Levels Description Points Earned per Student On or Above Grade Level for Science ACT Aspire: Ready or Exceeds APA Science Levels Independent or Functional Independence 1.0 Not at Grade Level for Science ACT Aspire Close or In Need of Support APA Science Levels: Supported Independence, Emergent, Not Evident 0.0 Includes full academic year students (not highly mobile). Students enrolled continuously from October 1 through testing.
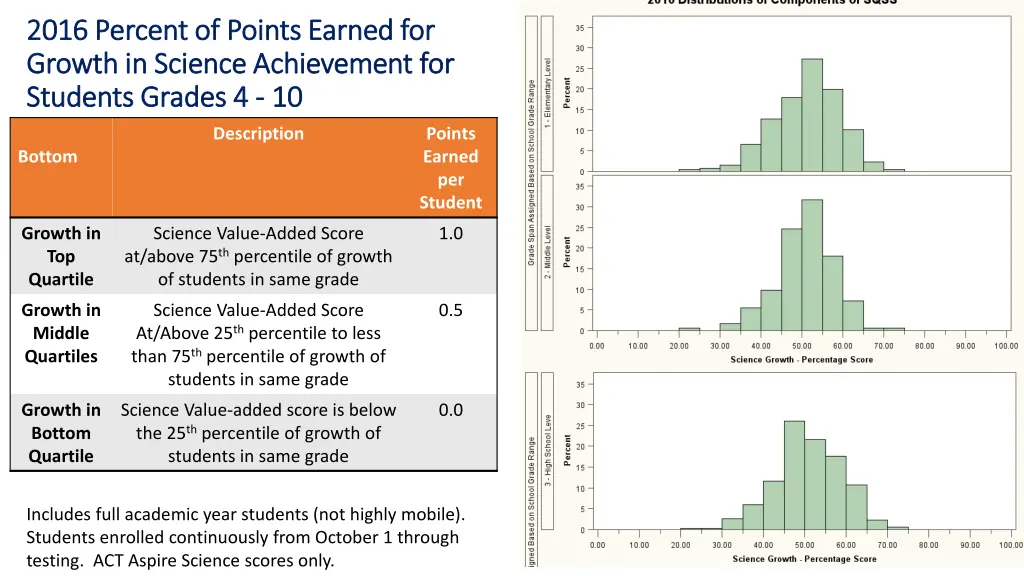
2016 Percent of Points Earned for 2016 Percent of Points Earned for Growth in Growth in Science Achievement for Science Achievement for Students Grades 4 Students Grades 4 - - 10 10 Description Points Earned per Student Bottom Growth in Top Quartile Science Value-Added Score at/above 75thpercentile of growth of students in same grade 1.0 Growth in Middle Quartiles Science Value-Added Score At/Above 25thpercentile to less than 75thpercentile of growth of students in same grade 0.5 Growth in Bottom Quartile Science Value-added score is below the 25thpercentile of growth of students in same grade 0.0 Includes full academic year students (not highly mobile). Students enrolled continuously from October 1 through testing. ACT Aspire Science scores only.
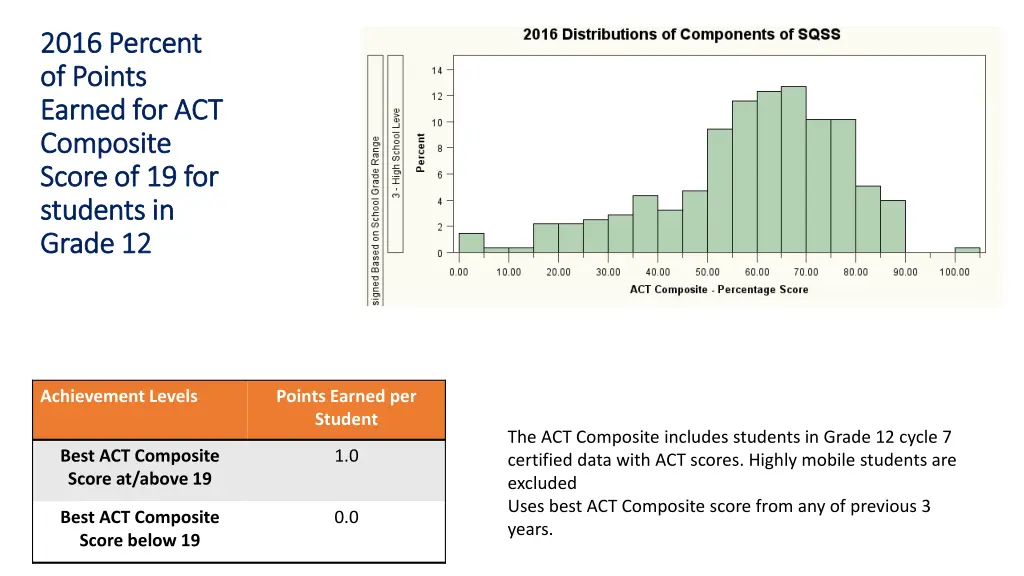
2016 Percent 2016 Percent of Points of Points Earned for ACT Earned for ACT Composite Composite Score of 19 for Score of 19 for students in students in Grade 12 Grade 12 Achievement Levels Points Earned per Student The ACT Composite includes students in Grade 12 cycle 7 certified data with ACT scores. Highly mobile students are excluded Uses best ACT Composite score from any of previous 3 years. Best ACT Composite Score at/above 19 1.0 Best ACT Composite Score below 19 0.0
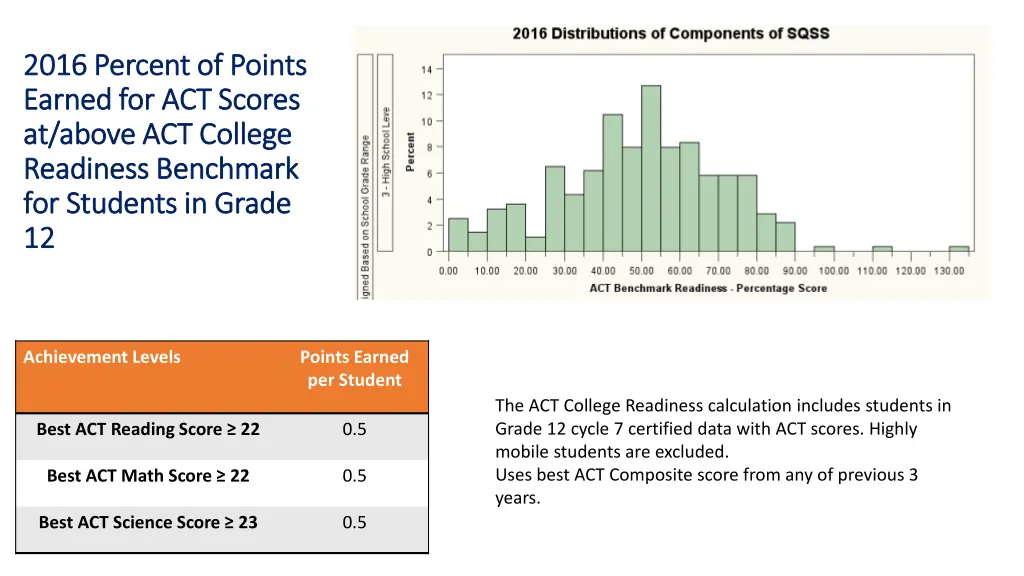
2016 Percent of Points 2016 Percent of Points Earned for ACT Scores Earned for ACT Scores at/above ACT College at/above ACT College Readiness Benchmark Readiness Benchmark for for Students Students in Grade 12 12 in Grade Achievement Levels Points Earned per Student The ACT College Readiness calculation includes students in Grade 12 cycle 7 certified data with ACT scores. Highly mobile students are excluded. Uses best ACT Composite score from any of previous 3 years. Best ACT Reading Score ≥ 22 0.5 Best ACT Math Score ≥ 22 0.5 Best ACT Science Score ≥ 23 0.5
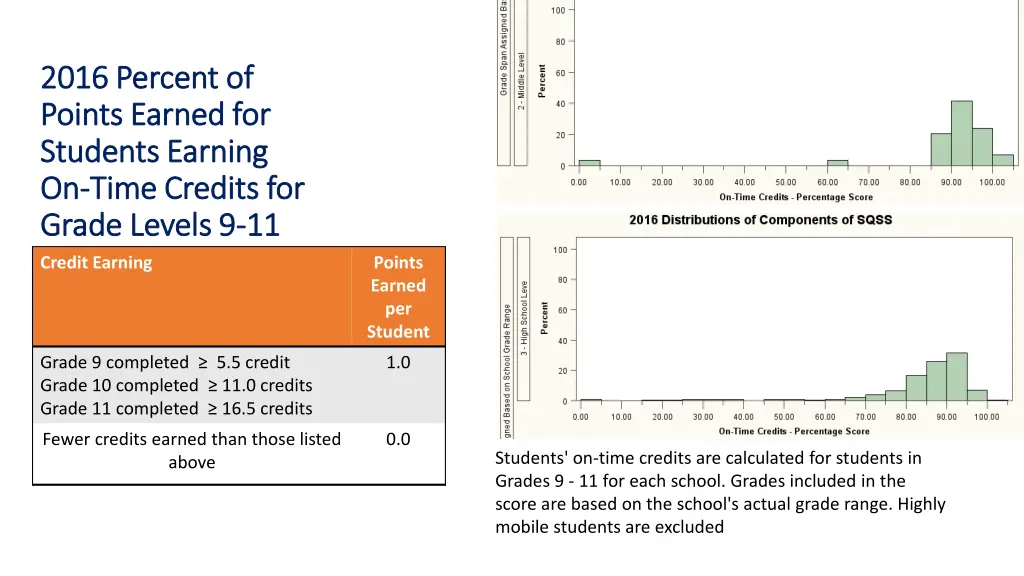
2016 Percent of 2016 Percent of Points Earned for Points Earned for Students Earning Students Earning On On- -Time Credits for Time Credits for Grade Levels 9 Grade Levels 9- -11 11 Credit Earning Points Earned per Student Grade 9 completed ≥ 5.5 credit Grade 10 completed ≥ 11.0 credits Grade 11 completed ≥ 16.5 credits 1.0 Fewer credits earned than those listed above 0.0 Students' on-time credits are calculated for students in Grades 9 - 11 for each school. Grades included in the score are based on the school's actual grade range. Highly mobile students are excluded
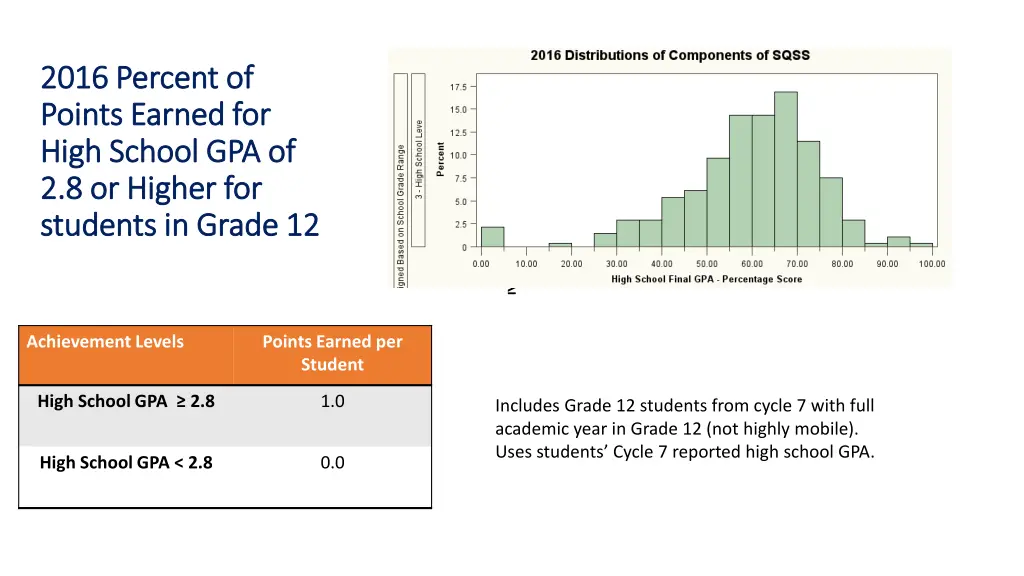
2016 Percent of 2016 Percent of Points Earned for Points Earned for High School GPA of High School GPA of 2.8 or Higher for 2.8 or Higher for students in Grade 12 students in Grade 12 ≥ Achievement Levels Points Earned per Student High School GPA ≥ 2.8 1.0 Includes Grade 12 students from cycle 7 with full academic year in Grade 12 (not highly mobile). Uses students’ Cycle 7 reported high school GPA. High School GPA < 2.8 0.0
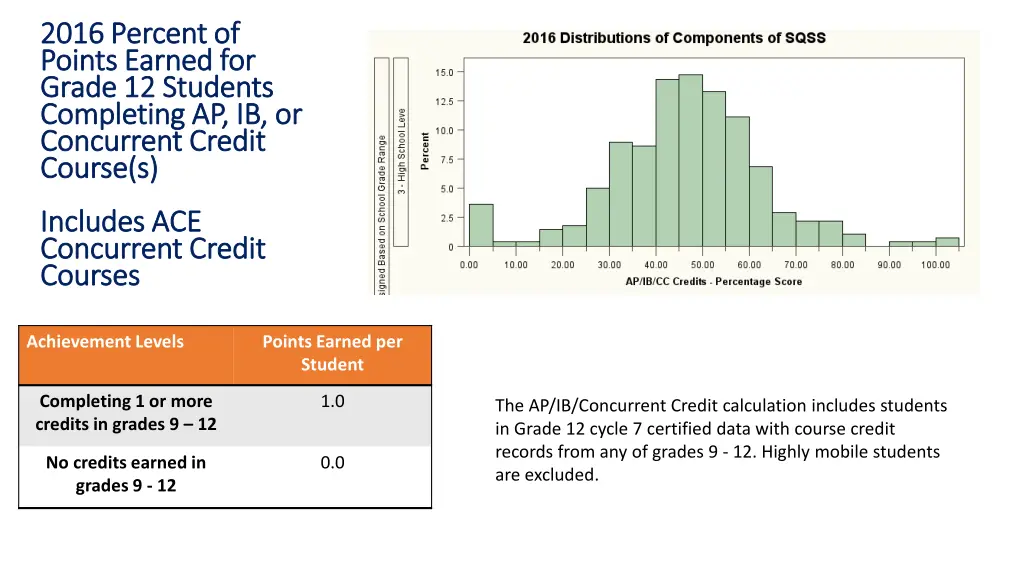
2016 Percent of 2016 Percent of Points Earned for Points Earned for Grade 12 Students Grade 12 Students Completing AP, IB, or Completing AP, IB, or Concurrent Credit Concurrent Credit Course(s) Course(s) Includes ACE Includes ACE Concurrent Credit Concurrent Credit Courses Courses Achievement Levels Points Earned per Student Completing 1 or more credits in grades 9 – 12 1.0 The AP/IB/Concurrent Credit calculation includes students in Grade 12 cycle 7 certified data with course credit records from any of grades 9 - 12. Highly mobile students are excluded. No credits earned in grades 9 - 12 0.0
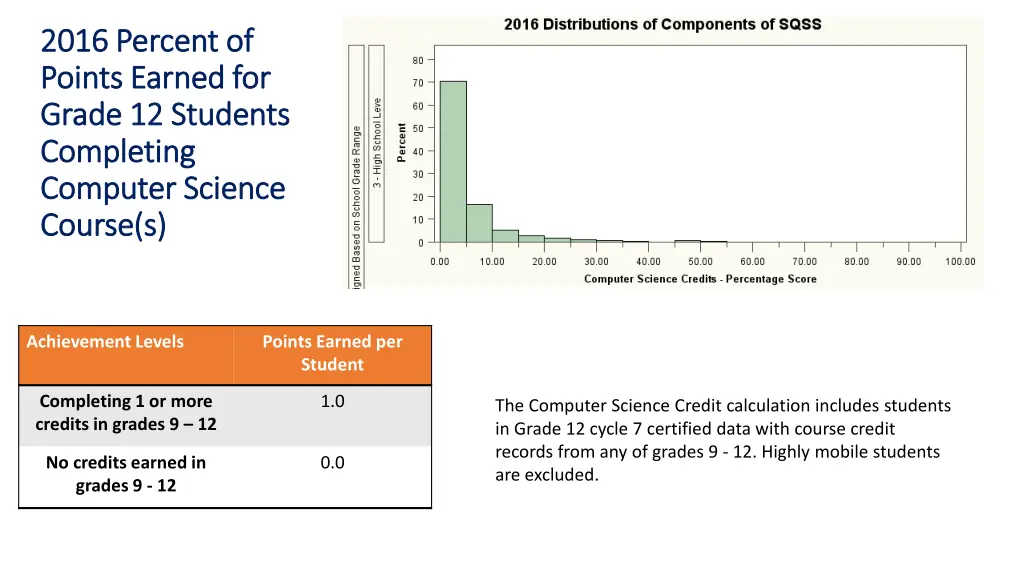
2016 Percent of 2016 Percent of Points Earned for Points Earned for Grade 12 Students Grade 12 Students Completing Completing Computer Science Computer Science Course(s) Course(s) Achievement Levels Points Earned per Student Completing 1 or more credits in grades 9 – 12 1.0 The Computer Science Credit calculation includes students in Grade 12 cycle 7 certified data with course credit records from any of grades 9 - 12. Highly mobile students are excluded. No credits earned in grades 9 - 12 0.0
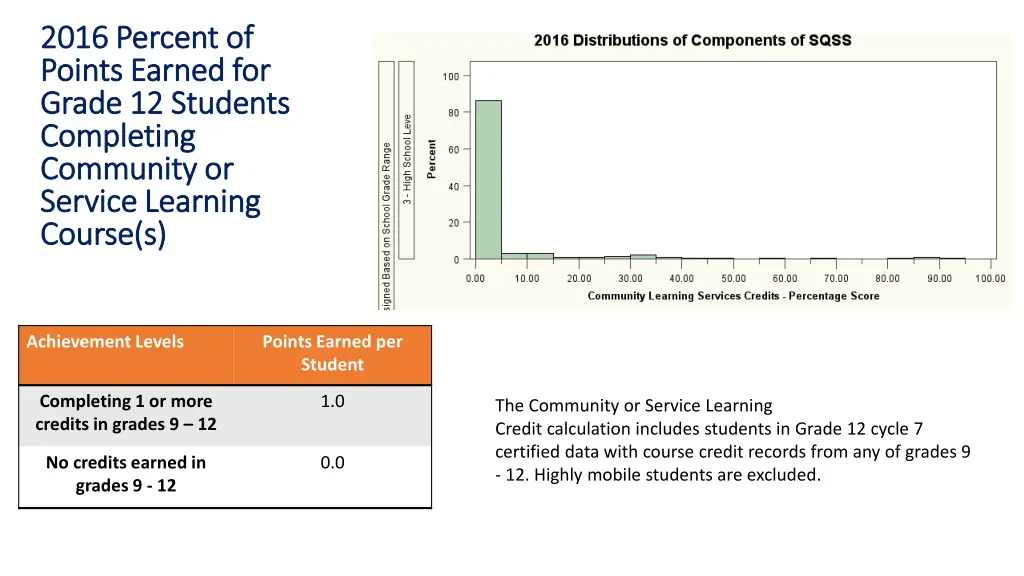
2016 Percent of 2016 Percent of Points Earned for Points Earned for Grade 12 Students Grade 12 Students Completing Completing Community or Community or Service Learning Service Learning Course(s) Course(s) Achievement Levels Points Earned per Student Completing 1 or more credits in grades 9 – 12 1.0 The Community or Service Learning Credit calculation includes students in Grade 12 cycle 7 certified data with course credit records from any of grades 9 - 12. Highly mobile students are excluded. No credits earned in grades 9 - 12 0.0
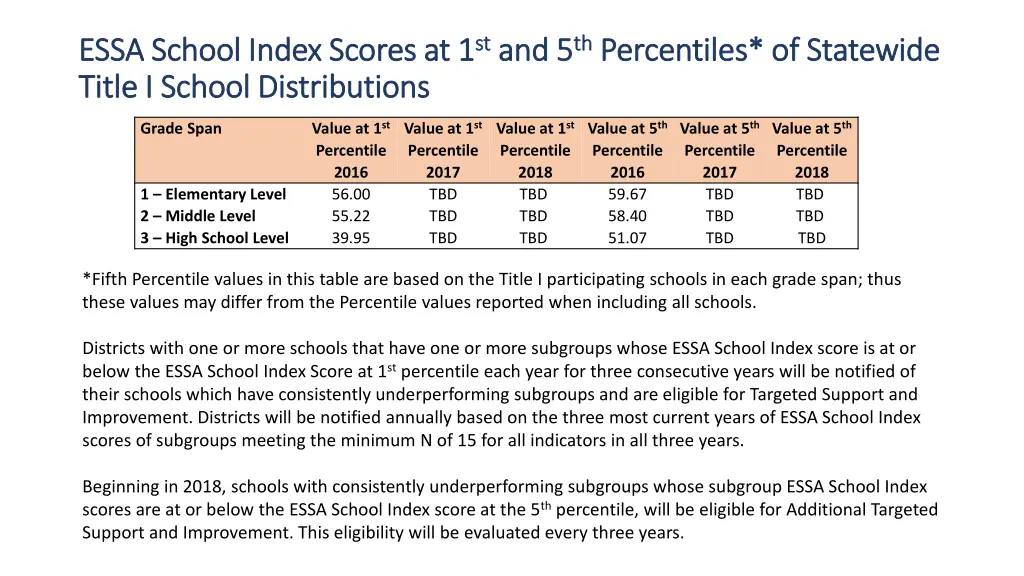
ESSA School Index Scores at 1 ESSA School Index Scores at 1st stand 5 Title I School Distributions Title I School Distributions and 5th thPercentiles* of Statewide Percentiles* of Statewide Value at 1st Percentile 2016 56.00 55.22 39.95 Value at 1st Percentile 2017 TBD TBD TBD Value at 1st Percentile 2018 TBD TBD TBD Value at 5th Percentile 2016 59.67 58.40 51.07 Value at 5th Percentile 2017 TBD TBD TBD Value at 5th Percentile 2018 TBD TBD TBD Grade Span 1 – Elementary Level 2 – Middle Level 3 – High School Level *Fifth Percentile values in this table are based on the Title I participating schools in each grade span; thus these values may differ from the Percentile values reported when including all schools. Districts with one or more schools that have one or more subgroups whose ESSA School Index score is at or below the ESSA School Index Score at 1stpercentile each year for three consecutive years will be notified of their schools which have consistently underperforming subgroups and are eligible for Targeted Support and Improvement. Districts will be notified annually based on the three most current years of ESSA School Index scores of subgroups meeting the minimum N of 15 for all indicators in all three years. Beginning in 2018, schools with consistently underperforming subgroups whose subgroup ESSA School Index scores are at or below the ESSA School Index score at the 5thpercentile, will be eligible for Additional Targeted Support and Improvement. This eligibility will be evaluated every three years.