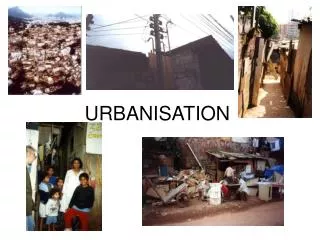
Urbanisation
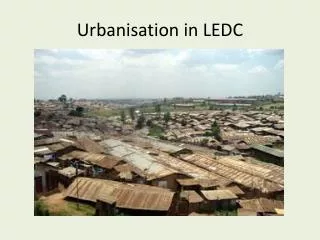
Urbanisation According to World Watch, urbanisation and income levels also to determine the type of waste generated. Raising prosperity and increasing the Urbanisation of the world population could lead to a doubling in the volume of municipal solid waste (MSW) created annually.

Urbanisation
E N D
Presentation Transcript
Urbanisation • According to World Watch, urbanisation and income levels also to determine the type of waste generated. • Raising prosperity and increasing the Urbanisation of the world population could lead to a doubling in the volume of municipal solid waste (MSW) created annually. • The researchers said that, projections indicate, challenging environmental and public health management in the World’s cities. • MSW tends to be According to the studies, generated in much higher quantities in wealthier regions of the World. • city dwellers are prospering and adopting high- consumption lifestyles. • The institute said that roughly a quarter of the World’s MSW Is diverted to recycling, composting or digestion.
MSW Scenario in India • Waste quantities are increasing and municipal authorities are not able to upgrade or scale up the facilities required for proper management of such wastes. • Key issues- There is no comprehensive short and long term plan with municipal authorities. • Majority of the municipal authorities do not have preparedness to set up waste processing and disposal facilities. • Waste management is being looked either for making wealth or generate revenue; or otherwise is allowed to putrefy in cities/towns. • In future, there will be a need to go for ‘total’ recycling and re-use of waste and aim for negligible or ‘Zero Waste’ for landfilling.
Status of Management of MSW: • As per report (May 2000), 1,00,000 MT of Municipal Solid Waste was generated. • During the year 2004-05, in 59 cities (35 Metro cities and 24 State Capitals) and estimated 39,031 Tons per day MSW generation in these 59 cities/towns. • (CIPET) has reported generation of 50,592 tonnes of MSW per day in the year 2010-11 in same 59 cities. • In the year 2009-12, 127486 TPD out of which 89334 TPD (70%) of MSW is collected and 15,881 TPD (12.45%) is processed or treated.
Waste Collection: • It has been observed that house-to-house collection is most critical issue in the entire Management of MSW. Waste Segregation • Source segregation of waste are insisted and pressurised with residents. Waste Transportation • Many of them are not following the waste transportation norms. Waste processing • The waste processing technologies reported in the country are; composting, vermin-composting, biogas plant, RDF –palletisation and others. Some of these pelletisation plants are associated with power plants for generation of electricity. However, mechanical composting and vermin-composting are more popular in the country.
Waste Disposal • Most of cities/towns are facing problem in identification of landfill sites for construction of sanitary landfills. Laying down Standards for State-of-the art Technologies Status of compliance with MSW Rules • Waste collection is observed only 70% of total waste generation and the remaining 30% lost in the urban environment Initiatives in Karnataka • The Government of Karnataka initiated an urban reform project called NirmalaNagaraYojane in 2003. • Studies have revealed that the quantum of waste generated varies between 0.2 - 0.4 kg/capita/day in urban cities and goes up to 0.5 kg/capita/day in metropolitan cites.
In spite of the various measures to treat waste the ULBs are currently unable to satisfactorily fulfil their general duties. • Most ULBs spend nearly 60%-70% of their total overall budgetary allocation on collection, another 20%-30% on transportation, and often less than 10% on the treatment and final disposal of MSW.