Transitioning from Discrete to Continuous Distributions in Statistics
160 likes | 283 Views
This process illustrates the transformation from discrete to continuous probability distributions using histograms. Initially, each bar in the histogram is split into two, continuing until we reach an uncountably large number of infinitely narrow bars. The resulting distribution becomes continuous and uniform between points A and B. Starting with a binomial distribution (p=0.5 and three bars), we note the varying heights of bars; as we split them, the tail-wards bar height decreases more than the center-wards one. Ultimately, we achieve a continuous normal distribution.

Transitioning from Discrete to Continuous Distributions in Statistics
E N D
Presentation Transcript
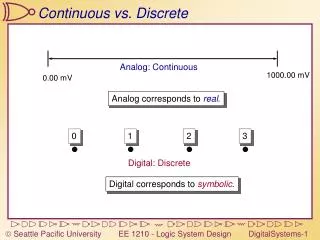
Discrete to Continuous In each step each bar in the histogram is split into two bars.
Now one final step, to an uncountably large number of bars, each infinitely narrow, yielding a continuous, uniform distribution ranging from A to B.
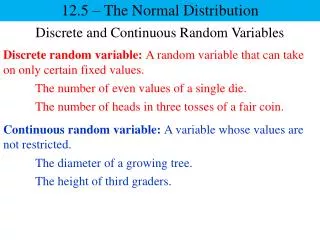
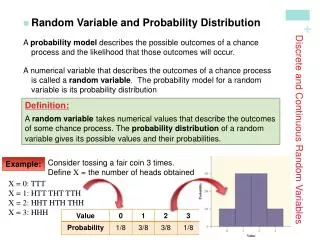
Now I do the same but I start with a binomial distribution with p = .5 and three bars. • Note that the bars are not all of equal height. • Each time I split one, I lower the height of the tail-wards one more than the center-wards one.
Now one final leap to a continuous (normal) distribution with an uncountably large number of infinitely narrow bars.