When you’re trying to make informed decisions in the stock market, one of the biggest challenges is gauging the sentiment of the market. This is where the Market Mood Index steps in. It’s a powerful tool designed to help investors and traders understand the underlying emotional state of the market — fear, greed, caution, or optimism. In this article, we will break down what the Market Mood Index is, how it works, and why it matters for your trading and investing strategy.
✅ What is the Market Mood Index?
The Market Mood Index (MMI) is a quantitative indicator that reflects the overall sentiment or emotional state of investors in the stock market. Developed to simplify the complexity of market psychology, the index consolidates data from multiple sources — such as price momentum, volatility, FII/DII activity, and market breadth — to provide a single score that represents how investors are feeling. Think of it as a mood ring for the market — showing whether traders are feeling greedy, fearful, or neutral.
🔍 How Does the Market Mood Index Work?
The Market Mood Index typically ranges from 0 to 100 and is divided into different sentiment zones: 0–30: Extreme Fear 31–50: Cautious 51–70: Neutral to Optimistic 71–100: Extreme Greed The score is updated daily and incorporates various market indicators such as: Volatility Index (VIX) Put Call Ratio Advance-Decline Ratios Volume Activity FII/DII Trends Each of these metrics gives insight into different aspects of investor behavior, and the Market Mood Index brings them together in a simplified, easy-to-read format.
📊 Why is the Market Mood Index Important?
Helps with Market Timing: When the Market Mood Index indicates extreme fear, it can signal a buying opportunity. Conversely, extreme greed may suggest it's time to book profits. Avoids Emotional Trading: Many investors make poor decisions based on fear or hype. The index acts as an emotional compass. Supports Risk Management: Traders use the MMI to adjust their position sizes or hedge portfolios depending on current sentiment. By understanding the Market Mood Index, you can navigate market cycles with better clarity and confidence.
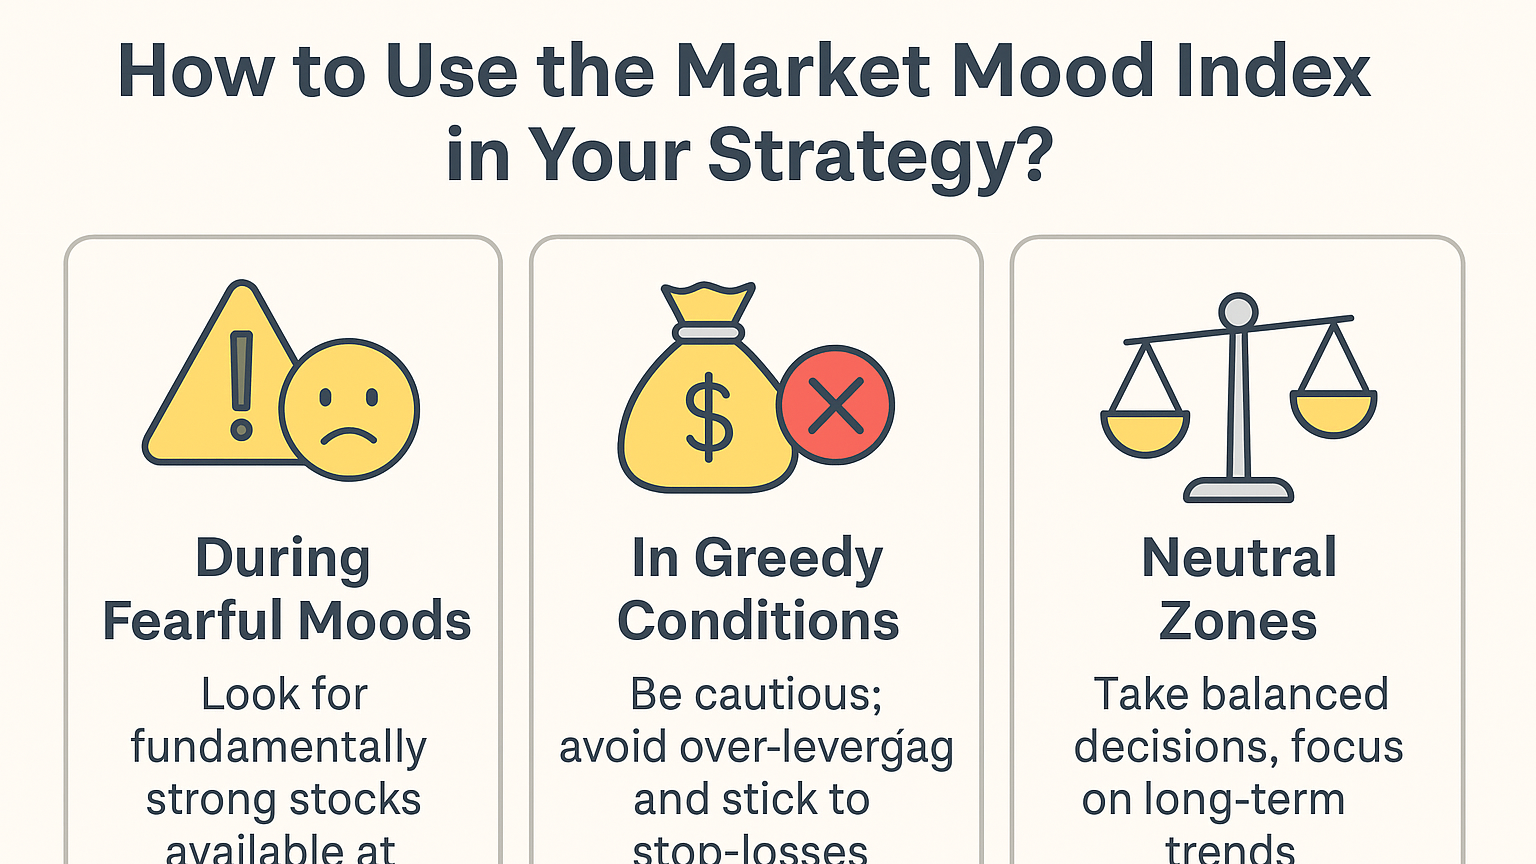
💡 How to Use the Market Mood Index in Your Strategy?
During Fearful Moods: Look for fundamentally strong stocks available at discounted prices. In Greedy Conditions: Be cautious; avoid over-leveraging and stick to stop-losses. Neutral Zones: Take balanced decisions, and focus on long-term trends. Professional investors often combine the Market Mood Index with technical indicators such as RSI, moving averages, and trend analysis to validate entry and exit points.
📈 Real-World Application Imagine
the Market Mood Index is showing a score of 25 — indicating extreme fear. The Nifty has dropped significantly, but fundamentally strong stocks are oversold. This might be the perfect time for contrarian investors to enter the market. On the other hand, a score of 85 suggests extreme greed — the market may be overheated and due for a correction.
Final Thoughts
The Market Mood Index is more than just a number — it’s a lens through which you can view and understand the pulse of the market. While it shouldn’t be the only factor in your decision-making process, it’s an excellent tool to add to your market analysis toolkit. Remember, smart investors don’t just analyze charts and earnings — they understand the emotions that move markets. And the Market Mood Index is your shortcut to doing just that.


