Download

1 / 78
780 likes | 823 Views
Explore the scope of macroeconomics, major issues like economic growth, unemployment, and inflation, and the circular flow of income in the national economy. Learn to measure national income using product, income, and expenditure methods.

E N D
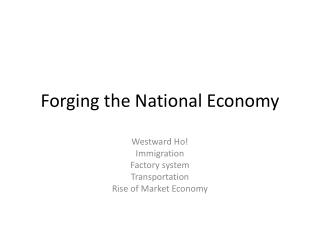
The National Economy The Scope of Macroeconomics
The scope of macroeconomics • Microeconomics and macroeconomics • The major macroeconomic issues • economic growth • unemployment • inflation
Nominal GDP and constant-price GDP, UK 1950–2012 Note: Years 2011 and 2012 figures based on forecasts Source: Based on data from UK Economic Accounts, (Office for National Statistics)
The scope of macroeconomics • Microeconomics and macroeconomics • The major macroeconomic issues • economic growth • unemployment • inflation • balance of payments and exchange rates
Economic growth (average % per annum), Unemployment (average %), Inflation (average % per annum)
Economic growth (average % per annum), Unemployment (average %), Inflation (average % per annum)
Economic growth (average % per annum), Unemployment (average %), Inflation (average % per annum)
The scope of macroeconomics • Microeconomics and macroeconomics • The major macroeconomic issues • economic growth • unemployment • inflation • balance of payments and exchange rates • Government macroeconomic policy • choosing between macroeconomic theories • choosing the order of priorities
The National Economy The Circular Flow of Income
The circular flow of income • The inner flow
Consumption of domestically produced goods and services (Cd) Factor payments The circular flow of income Firms Households
The circular flow of income • Withdrawals • net saving • net taxes • import expenditure • Injections • investment • government expenditure • export expenditure
Export expenditure (X) Investment (I) Government expenditure (G) BANKS, etc ABROAD GOV. Import expenditure (M) Net taxes (T) Net saving (S) The circular flow of income INJECTIONS Consumption of domestically produced goods and services (Cd) Factor payments WITHDRAWALS
The circular flow of income • The relationship between injections and withdrawals • the links between them • planned injections may not equal planned withdrawals • Equilibrium in the circular flow • The circular flow and the four macroeconomic objectives
The National Economy Measuring National Income
Measuring national income • The three ways of measuring GDP • the product method • the income method • the expenditure method
The circular flow of national income and expenditure (1) Production (2) Incomes (3) Expenditure
Measuring national income • The product method • the problem of double counting • the measuring of value added • gross value added (GVA) • some qualifications • stocks • government services • ownership of dwellings • taxes and subsidies on products
UK GVA (product-based measure): 2009 Agriculture, forestry and fishing 8909 Mining, energy and water supply 47 658 Manufacturing 139 889 Construction 72 994 Wholesale and retail trade; repairs 140 344 Hotels and restaurants 35 100 Transport and communication 87 410 Banking, finance, insurance, etc. 125 987 Renting and business activities 298 518 Public administration and defence 65 375 Education, health and social work 170 279 Other social and personal services 63 261 Total GVA 1 255 724
UK GVA (product-based measure): 2009 0.7 3.8 11.1 5.8 11.2 2.8 7.0 10.0 23.8 5.2 13.6 5.0 100.0 Agriculture, forestry and fishing 8909 Mining, energy and water supply 47 658 Manufacturing 139 889 Construction 72 994 Wholesale and retail trade; repairs 140 344 Hotels and restaurants 35 100 Transport and communication 87 410 Banking, finance, insurance, etc. 125 987 Renting and business activities 298 518 Public administration and defence 65 375 Education, health and social work 170 279 Other social and personal services 63 261 Total GVA 1 255 724 Percentage of GVA
UK GVA (product-based measure): 2009 0.7 3.8 11.1 5.8 11.2 2.8 7.0 10.0 23.8 5.2 13.6 5.0 100.0 Agriculture, forestry and fishing 8909 Mining, energy and water supply 47 658 Manufacturing 139 889 Construction 72 994 Wholesale and retail trade; repairs 140 344 Hotels and restaurants 35 100 Transport and communication 87 410 Banking, finance, insurance, etc. 125 987 Renting and business activities 298 518 Public administration and defence 65 375 Education, health and social work 170 279 Other social and personal services 63 261 Total GVA 1 255 724 Percentage of GVA
Measuring national income • The income method • adding factor earnings • some qualifications • stock appreciation • transfer payments • direct taxes; taxes and subsidies on products
UK GVA by category of income: 2009 Compensation of employees (wages and salaries) 769 779 Operating surplus (gross profit, rent and interest of firms government and other institutions) 385 755 Mixed incomes 84 189 Tax less subsidies on production (other than those on products) plus statistical discrepancy 16 001 Total GVA 1 255 724
UK GVA by category of income: 2009 Compensation of employees (wages and salaries) 769 779 Operating surplus (gross profit, rent and interest of firms government and other institutions) 385 755 Mixed incomes 84 189 Tax less subsidies on production (other than those on products) plus statistical discrepancy 16 001 Total GVA 1 255 724 Percentage of GVA
UK GVA by category of income: 2009 61.3 30.7 6.7 1.3 100.0 Compensation of employees (wages and salaries) 769 779 Operating surplus (gross profit, rent and interest of firms government and other institutions) 385 755 Mixed incomes 84 189 Tax less subsidies on production (other than those on products) plus statistical discrepancy 16 001 Total GVA 1 255 724 Percentage of GVA
From GVA to GDP: 2009 GVA (gross value added at basic prices) £1,255,724m plus VAT and othertaxes on products £142,784m less Subsidies on products –£5,803m GDP (at market prices) £1,392,705m
From GVA to GDP: 2009 GVA (gross value added at basic prices) £1,255,724m plus VAT and othertaxes on products £142,784m less Subsidies on products –£5,803m GDP (at market prices) £1,392,705m
From GVA to GDP: 2009 GVA (gross value added at basic prices) £1,255,724m plus VAT and othertaxes on products £142,784m less Subsidies on products –£5,803m GDP (at market prices) £1,392,705m
Measuring national income • The expenditure method • C + G + I + X – M • Gross national income (GNY) • Net national income (NNY)
UK GDP by category of expenditure, GNY and NNY: 2009 £million Consumption expenditure of households and NPISH (C) 908 788 Government final consumption (G) 327 682 Gross capital formation (I) 190 667 Exports of goods and services (X) 386 648 less Imports of goods and services (M) –418 671 Statistical discrepancy 2 409 Gross domestic product (GDP) (at market prices) 1 392 705
UK GDP by category of expenditure, GNY and NNY: 2009 £million Consumption expenditure of households and NPISH (C) 908 788 Government final consumption (G) 327 682 Gross capital formation (I) 190 667 Exports of goods and services (X) 386 648 less Imports of goods and services (M) –418 671 Statistical discrepancy 2 409 Gross domestic product (GDP) (at market prices) 1 392 705 plusNet income from abroad 30 431 Gross national income (GNY) 1 423 436
UK GDP by category of expenditure, GNY and NNY: 2009 £million Consumption expenditure of households and NPISH (C) 908 788 Government final consumption (G) 327 682 Gross capital formation (I) 190 667 Exports of goods and services (X) 386 648 less Imports of goods and services (M) –418 671 Statistical discrepancy 2 409 Gross domestic product (GDP) (at market prices) 1 392 705 plusNet income from abroad 30 431 Gross national income (GNY) 1 423 436 lessCapital consumption (depreciation) –152 672 Net national income (NNY) 1 270 464
Measuring national income • Households' disposable income • Taking account of: • inflation • population • purchasing power (PPP measures)
Measuring national income • National income statistics: suitable measures of living standards? • items that are excluded • non-marketed items • the underground economy • production: poor indicator of welfare? • production does not equal consumption • human costs of production • externalities • the production of 'regrettables' • distribution of income • The use of ISEW
Contributions to the Index of Sustainable Economic Welfare (ISEW) (£ per capita, 1990 prices)
Contributions to the Index of Sustainable Economic Welfare (ISEW) (£ per capita, 1990 prices)
Contributions to the Index of Sustainable Economic Welfare (ISEW) (£ per capita, 1990 prices)
Contributions to the Index of Sustainable Economic Welfare (ISEW) (£ per capita, 1990 prices)
ISEW 1950-96 (maximum = 100) UK USA
ISEW 1950-96 (maximum = 100) UK Netherlands USA
The National Economy Short-term Growth and the Business Cycle
Short-term growth & the business cycle • Actual and potential national income • actual growth • the % increase in actual output • potential economic growth • the % increase in the economy’s capacity • Economic growth & the production possibility curve
Growth in actual output c b a Growth and the production possibility curve Good X O Good Y