Download
1 / 44
450 likes | 682 Views
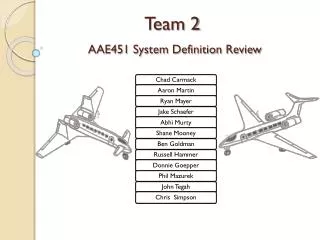
Team 2 AAE451 System Definition Review. Outline. Mission Statement Major Design Requirements Concept Selection Overview Pugh’s method Advanced Technologies Technologies incorporated Impact on sizing Constraint Analysis Major performance constraints Basic Assumptions

E N D
Outline • Mission Statement • Major Design Requirements • Concept Selection • Overview • Pugh’s method • Advanced Technologies • Technologies incorporated • Impact on sizing • Constraint Analysis • Major performance constraints • Basic Assumptions • Constraint diagrams • Sizing Studies • Design Mission • Current sizing approach • Propulsion Selection
Mission Statement • To be the primary systems integrator of a high speed, long range executive transport system with unprecedented efficiency and minimal environmental impact.
Major Design Requirements Design Target Goals • Meet NASA N+2 (2020) Goals • 42 db Below Stage 4 Noise Requirements • 75% Below CAEP-6 NOx Emissions • 40% Fuel Reduction • 17 Passengers • Cruise Mach 0.85 • 7100 nm Headwind Range • General Aviation Airport Capable • 42,000 ft. Initial Cruise Altitude
Design Mission 2 3 7 6 Alternate Los Angeles Hong Kong 0 1 4 5 8 9 0-1: Take off to 50 ft. 5-6: Climb to 5000 ft. (Best Rate) 1-2: Climb to 42000 ft. (Best Rate) 6-7: Divert to Alternate 200 nm 2-3: Cruise at Mach 0.85 7-8: 45 minute Holding Pattern 3-4: Decent to Land (No Range Credit) 8-9: Land 4-5: Missed Approach (Go Around) 7100 nm 200 nm
Pugh’s Method Process • Eight initial designs were presented and discussed • A concept was chosen for baseline comparisons • Each design was evaluated for each criterion • Every design was assigned a +, -, or S • All criteria are equally weighted • All +, -, and S ratings were individually totaled for each design • In Pugh’s method, each aircraft’s ratings are not summed • Positives and negatives were investigated • Positives were applied to other designs • Designs were narrowed to four, and a new baseline was chosen • All criteria were re-evaluated with the new baseline • After iterating, two designs were chosen for further investigation
Concepts Overview Concept 1 Concept 2 Concept 3 Concept 5 Concept 6 Concept 4 Concept 7 Concept 8
Concept 1 Rear fuselage mounted engines T-tail Circular Fuselage Low wing
Concept 2 • Lifting Canards • Vertical stabilizer • Rear mounted engines
Advanced Technology • Unducted Propfan • Composite Materials http://www.aviation.ru/jno/MACS97/An-70-engine.jpg
Unducted Propfan • Unducted Fan shows promise to reduce emissions and fuel consumption • “ERA is focused on the goals of NASA’s N+2, a notional aircraft with technology primed for development in the 2020 time frame as part of the agency’s subsonic fixed wing program” Aviation Week Dec 14, 2009 on the development of UDF 13 http://f00.inventorspot.com/images/Test%20Prop.jpg
Benefits of UDF • Relative to 1998 levels, NASA plans to reduce cumulative noise levels to 42 dB below stage 4, 75% lower NOx emissions, and reduce fuel burn by 40% • Aviation Week on N+2 goals regarding UDF 14
How to Model UDF? • According to Aviation Week Current UDF Tests State that the UDF is Capable of: • 25%-30% better fuel burn than current engines • 20% lower NOx emissions than current engines • Good probability of meeting N+2 goals by 2020
How to Model UDF? • Use a benchmark engine built on or before 1998 • Calculate fuel burn and emissions via projected N+2 percentages • Assume Stage 4 noise compliance • Use GE36 blade diameter with a thrust scale factor for engine diameter
Composite Materials • Significant Empty Weight Savings • Proven Technology • Significant Savings in Production Cost • Up to 50% of Structure Could Be Constructed from Composite Materials Based on Historical Aircraft http://www.comglasco.com/product_line/automotive/aluminun/comglasco0072.jpg
How to Model Composite Materials • Initial Plan Was to Use Database of Weight Fraction of Composite Hawker 4000 With Comparable Designs *All Weights Courtesy of Jane’s All The World’s Aircraft
New Method to Model Composites • No Significant Weight Fraction Difference With Hawker 4000 • Hawker used weight savings from composites to increase cabin volume for a very comfortable ride for aircraft category weight • New Method is to Use a 20% Empty Weight Reduction* *based of historical estimates from http://www.aviation-history.com/theory/composite.htm
Constraint Diagrams • Basic assumptions and initial estimates for aircraft concepts • (CL)maxT/O = 1.5 • (CL)maxLanding = 2.0 • CD0 = .0180 • e = .8 • Mcruise = .85 • Cruise Altitude = 42,000 ft • AR = 10.5 (canard) • AR = 8 (conventional) • No thrust reversers
Constraint Diagram of Conventional Aircraft Landing ground roll 2600 ft
Sizing Code • Current status: • MATLAB script • Inputs: ~100 variables describing each aircraft • Fuel Weight • Engine Model (flight profile analysis) • Drag Prediction (component buildup) • Empty Weight (component buildup) • Correlation Factors (to similar aircraft) • Technology Factors (engines) • Calculates gross weight
MATLAB Code Flowchart Initial Guess Wo Geometry Calculations We Prediction Wfuel Prediction Engine Model Drag Calculation Set W0 guess to W0 calc W0 Calculation W0 = W0 calc
Input Variables • From constraint diagram • W0/S = 76 (conventional), 84 (canard) • TSL/W0 = .33 • Wing, Canard, and Tail • Geometric variables (AR, Taper ratio, sweep, etc) • Fuselage • Dimensions, shape, etc. • Engines • Weight, number, size, etc. • Mission Variables • Range, Cruise Mach, etc. • Location of components (for xcgcalculuation)
Assumptions • Flight conditions are constant over 500 ft altitude intervals during climb and descent. • Engine data is scalable • It was assumed that the equations in Daniel Raymer’s textbook were accurate
Validation • Correlated Conventional design to G550 and Canard design to Beechcraft Starship
Drag Prediction • Used to help predict: • Engine size • Amount of fuel • Coast of aircraft
How to model Drag? • Component build up of different types of drag: • Parasite drag • Skin friction • Pressure drag • Interference drag • Induced drag • Miscellaneous rag • Wave drag • Assumed 20 counts of drag
Skin Friction • Assumed turbulent flow for conceptual design. • Schlicting Formula
Pressure Drag • Body component shape dependant
Interference Drag • Drag from different components interacting with each other Q = 1 Q = 1.2 Q = 1 Q = 1.5
Parasite Drag Build-up * All values are at Cruise Conditions
Benchmark Engine • Rolls Royce BR700 Series • First Production Run in 1994 • The BR700 Series has a thrust range of 14,750 lbf - 22,000 lbf range to allow for “rubber engine” design http://de.academic.ru/pictures/dewiki/69/Engine_BR710-1.jpg
Fuel Weight Prediction • Imported engine data curves • Curves were scaled based on the sea-level static thrust • Interpolated to find points not on curves • Calculated TSFC for different segments of the design mission • Fuel weight predicted for each segment
Engine Selection • Unducted Propfan Modeled Off of Previous Data and N+2 Goals, as Stated Before • Geared Turbofan Stated to Start Production Between Now and 2020 http://www.flug-revue.rotor.com/FRHeft/FRHeft07/FRH0702/FR0702c1.JPG http://bryanandhannah.net/assets/clip_image002.jpg
Geared Turbofan • Uses a gear to decouple the fan from the low pressure turbine, thus allowing a large fan to spin slowly and a small turbine to spin quickly increasing efficiency http://www.profeng.com/NR/rdonlyres/B0A36366-BDBD-49EF-8C87-ACA1E3630B03/0/211300212.jpg
Pratt & Whitney PurePower PW1000 • First ultra-high bypass ratio turbofan engine • Light-weight, low pressure fan design • 20 dB Quieter than current engines • Proven Efficiency with No life-limited parts • Reduce NOx emissions (50% margin to CAEP/6) • 13,000-17,000 lbf Thrust for 1215G or 21,000-24,000 lbf Thrust for 1524G • 15% Reduction in Fuel Burn http://www.purepowerengine.com.html
Pros Very Efficient N+2 goals likely met Light Weight (direct drive) Cons Noise Technology Still in Devlopment Large Diameter Pros Reasonably Efficient Quiet In Production by 2016 Low Emissions Cons Large Diameter Casing (70in) Not a lot of Data Heavy (gearing) UDF PurePower
Static Margin(SM) • Conventional • CG = 51% of fuselage length • SM = 37% of Cmac • Canard • CG = 74% of fuselage length • SM = 29% of Cmac
Requirements Compliance Matrix * Value estimated at current stage in analysis
Summary & Next Steps • Summary • Two concepts selected for detailed analysis • Sizing improved using component based method and engine model • Early stability and control estimates developed • Next Steps • Select final engine classification (GTF or UDF) • Detailed aerodynamic analysis (airfoil selection, etc) • Detailed stability analysis • Refine sizing code