Download
1 / 1
10 likes | 116 Views
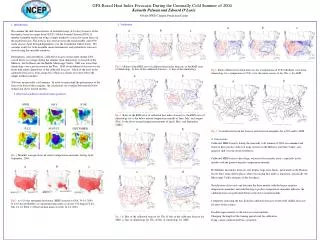
GFS-Based Heat Index Forecasts During the Unusually Cold Summer of 2004 Kenneth Pelman and Edward O’Lenic NOAA-NWS-Climate Prediction Center. 3. Validation.

E N D
GFS-Based Heat Index Forecasts During the Unusually Cold Summer of 2004Kenneth Pelman and Edward O’LenicNOAA-NWS-Climate Prediction Center 3. Validation 1. Introduction:We examine the skill characteristics of extended-range (6-10 day) forecasts of the heat index, based on output from NCEP’s Global Forecast System (GFS) 23-member ensemble model and using a simple method to correct for recent biases in the model forecasts. The forecast data used are from the unseasonably cold 2004 warm season (April through September) over the Continental United States. We consider results for both ensemble mean deterministic and probabilistic forecasts created using the ensemble members.Deterministic and probabilistic calibrated forecasts of heat index during 2004 scored better, on average during the summer, than climatology over much of the Midwest, the Northeast and the Middle Mississippi Valley. Skill was lower than climatology over a good portion of the West. Skill of uncalibrated forecasts was far lower than either climatology or the calibrated forecasts. Much of the error in the calibrated forecasts is from a large bias which was clearly not corrected by the simple method used here.2004 was an unusually cold summer. In order to understand the performance of the forecast in both of these regimes, the calculations are stratified between the below normal and above normal months. a b c a b c Fig.3 a) Ratio of the RMS error of calibrated heat index forecasts to the RMS error of climatology, b) bias of the calibrated forecasts, c) bias of the climatology. Fig.6 Ratio of Brier Score from forecasts for a temperature of 95 F with Brier score from climatology for a temperature of 95 F a) for the entire season, b) for JJA, c) for AMS a b a b 2. Observed conditions and heat index products APRIL MAY JUNE Fig 4. Ratio of the RMS error of calibrated heat index forecasts to the RMS error of climatology for a) the below normal temperature months of June, July, and August (JJA), b) the above normal temperature months of April, May, and September (AMS). a b JULY AUGUST SEPTEMBER Fig. 7 Correlation between the forecast and observed anomalies for a) JJA and b) AMS 4. Conclusions Calibrated MHI forecasts during the unusually cold summer of 2004 are examined and found to have positive skill over large sections of the Midwest and Ohio Valley, and negative skill over the desert Southwest. Calibrated MHI forecasts have large, uncorrected systematic errors, especially in the months with the greatest negative temperature anomaly. Probabilistic heat index forecasts also display large error biases, particularly in the Rockies, but do show some skill in places where forecasting heat index is important, specifically the Mississippi Valley and parts of the Southeast. Stratification of forecasts and data into the three months with the largest negative temperature anomalies and with the largest positive temperature anomalies indicates the calibrated forecasts performed better in the above normal months. Completely removing the bias from the calibrated forecasts would yield skillful forecasts for most of the country. Possible improvements to the forecast system include: Changing the length of the training period used for calibration. Using a more sophisticated bias correction Fig. 1 Monthly average observed surface temperature anomalies during April- September, 2004. a b c c d Fig.2 a) 6-10-day maximum heat index (MHI) forecast for July 10-14, 2004, b) 6-10-day probability of a maximum heat index of at least 100 degrees F for July 10-14, 2004, c) Observed heat index for July 10-14, 2004. Fig. 5 a) Bias of the calibrated forecast for JJA, b) bias of the calibrated forecast for AMS, c) bias of climatology for JJA, d) bias of climatology for AMS.