Global Scale Integrated Assessment: Path to Policy Development
280 likes | 377 Views
Explore initial steps taken by JRC towards integrated assessment at the global scale, focusing on emission databases, economic energy models, and climate impacts. Discover mission, methodology, and preliminary results driving future policies.

Global Scale Integrated Assessment: Path to Policy Development
E N D
Presentation Transcript
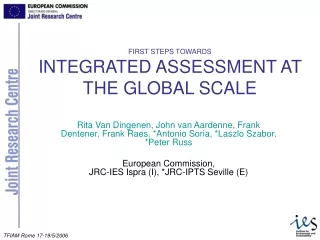
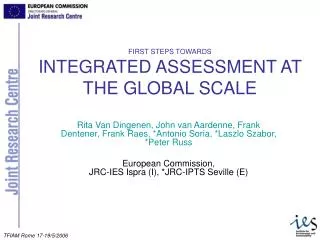
FIRST STEPS TOWARDSINTEGRATED ASSESSMENT AT THE GLOBAL SCALE Rita Van Dingenen, John van Aardenne, Frank Dentener, Frank Raes, *Antonio Soria, *Laszlo Szabor, *Peter Russ European Commission, JRC-IES Ispra (I), *JRC-IPTS Seville (E)
Rationale • Mission of JRC: provide scientifically-sound support for conception, development, monitoring, … of policies at EU level. • Local and short term co-benefits for non-annex 1 countries issue in climate negotiations • Kyoto flexible mechanisms: implications location of emission reductions (Climate forcing/AQ)? • Hemispheric transport of pollution • Increasing contribution ship/aviation emissions • Difference with NEC-GP: Climate Change included
Background • JRC has developed home-expertise in • global atmospheric chemistry modelling based on standard emission scenarios (TM5) • emission database development EDGAR (JRC-IES, Ispra; RIVM,Nl) • economic energy model POLES (JRC-IPTS, Seville) • Links and ongoing collaboration with • MPI Hamburg (ECHAM climate model) • IIASA (emission scenarios) • Hadley Center (meteo fields)
TM5 • Global Chemical Transport Model • Emissions: EDGAR/RAINS • Meteo: ECMWF fields (3 hourly) • Base resolution 6°x9° • 2 step 2-way nested to 1°x1° over selected regions • Krol et al., 2005 Atmospheric Chemistry and Physics, Vol. 5, pp 417-432
Background • JRC has developed home-expertise in • global atmospheric chemistry modelling based on standard emission scenarios (TM5) • emission database development EDGAR (JRC-IES, Ispra; RIVM,Nl) • economic energy model POLES (JRC-IPTS, Seville) • Links and ongoing collaboration with • MPI Hamburg (ECHAM climate model) • IIASA (emission scenarios) • Hadley Center (meteo fields)
Emission Database for Global Atmospheric Research (EDGAR) RIVM (NL) TNO (NL) MPI (D) JRC (EU) Emissions air pollutants and GHG 1970-2000on 1x1 grid by country by region Emissions by sector, country Time series of emissions
Background • JRC has developed home-expertise in • global atmospheric chemistry modelling based on standard emission scenarios (TM5) • emission database development EDGAR (JRC-IES, Ispra; RIVM,Nl) • economic energy model POLES (JRC-IPTS, Seville) • Links and ongoing collaboration with • MPI Hamburg (ECHAM climate model) • IIASA (emission scenarios) • Hadley Center (meteo fields)
The POLES Model • Prospective Outlook on Long-Term Energy Systems • Global sectoral model of world energy system. • Output: • Long-term (2030, 2050) world energy outlooks (47 countries/regions) • CO2 emission marginal abatement cost curves by region; emission trading system analysis • Technology improvement scenarios
Background • JRC has developed home-expertise in • global atmospheric chemistry modelling based on standard emission scenarios (TM5) • emission database development EDGAR (JRC-IES, Ispra; RIVM,Nl) • economic energy model POLES (JRC-IPTS, Seville) • Links and ongoing collaboration with • MPI Hamburg (ECHAM climate model) • IIASA (emission scenarios) • Hadley Center (meteo fields)
Climate model ECHAM Impacts Atmospheric chem. + transp. TM5 Emission inventory EDGAR RAINS Economy model POLES
Very first results and developments • Scenario studies on future emissions of greenhouse gases and air pollutants • EDGAR-POLES collaboration • Global estimate of agricultural losses due to Ozone
Scenario studies on future emissions of greenhouse gases and air pollutants.Collaboration EDGAR-POLES. EDGAR 1970 2000 2030 2050 POLES Methodology: Aggregate EDGAR fuel, sector, country detail to POLES level for Yr 2000 Transfer EDGAR (aggregated) EF to POLES Include abatement in EF
Scenario studies on future emissions of greenhouse gases and air pollutants.Collaboration EDGAR-POLES. i: compound j: country k: sector l: process by fuel/technology m:abatement techn. t: time (year) AC: activity data EF:emission factor (no explicit abatement technology specified but application of technology included in emission factor for each year) AC: 2000-2050 from POLES EF: 2000-2050 from EDGARv32FT2000 Interface developed to match: j: 47 POLES regions with 240 EDGAR countries k,l : differences in fuel and sector detail (e.g. Power plants POLES vs public electricity, autoproduction, combined heat).
Scenario studies on future emissions of greenhouse gases and air pollutants (preliminary results) China: residential combustion USA: residential combustion More info: John van Aardenne, JRC-IES
IPCC4 Experiment II: 2030 Photocomp Scenarios/simulation S1-S5
TM5 Year 2000 averaged surface ozone Change in surface ozone 2000 – 2030 (CLE)
First application:Economic evaluation of crop losses (2000) due to O3 damage Approach of Wang and Mauzerall (2004), but on global scale • Calculcate global 1°x1°AQ index (based on 1 hourly surface ozone concentration). AQ index: M7, W126 (for comparison with W&M) • Average grids over country, weighing according to crop suitability index SI: IIASA-FAO, alternatively: GLC2000 AQav = S(AQ*SI)/S(SI) • Apply for each country exposure-yield relationship = national Relative Yield Loss (RYL) • Crop Production Loss (CPL) = actual production * RYL/(1-RYL)Production data from FAO • Economic cost = Local Market Price * CPL
Suitability index for crop cultivation (FAO/IIASA GAEZ project) WHEAT MAIZE SOYBEANS RICE
50000 20000 10000 5000 2000 1000 500 200 100 50 20 10 5 2 1 M$
Agricultural production losses - Due to climate change (2080, A2 scenario): all crops + lifestock (G. Fischer, IIASA) - Due to ozone (2030, CLE), 4 crops (this work)
Outlook • Truly AP-CC integrated approach • Scenario and emission database development (EDGAR-POLES, EDGAR-RAINS) • Impact assessment and CBA Vegetation O3 flux for crops and forest trees according to ICP Modelling&Mapping recommendations for large scale IAM (generic stomatal flux, no effect of drought) Human health O3 and PM • Sector-based climate change study (EDGAR – ECHAM)
Climate+ soil + terrain constraints for agriculture,crop distribution O3 fields and AQ indices Crop production model (Basic Linked System) production demand trade IIASA soil, terrain database ECHAM Meteo GHG AP Climate-Chem model EDGAR RAINS POLES emission scenario energy & technology scenario POLES, IIASA
2000 Development of future emission inventories EDGAR (2000) POLES EDGAR Activity data (sector, fuel, technology) Energy market Aggregated EDGAR Activity POLES Activity data (sector, fuel, technology) EF (s,f,t) POLES EF (s,f,t) Air pollution emission inventory (2000) Air pollution emission inventory (Current, future)
Projected anthropogenic emissions NOx (Tg NO2 y-1) SRES A2 SRES B2 IIASA CLE CLE Asia + Oceania CLE N America IIASA MRF 1990 2000 2010 2020 2030 CLE Europe + Russia
Exposure-Yield parametrisations: From open-top chamber experiments in Europe and US