Download
1 / 23
300 likes | 573 Views
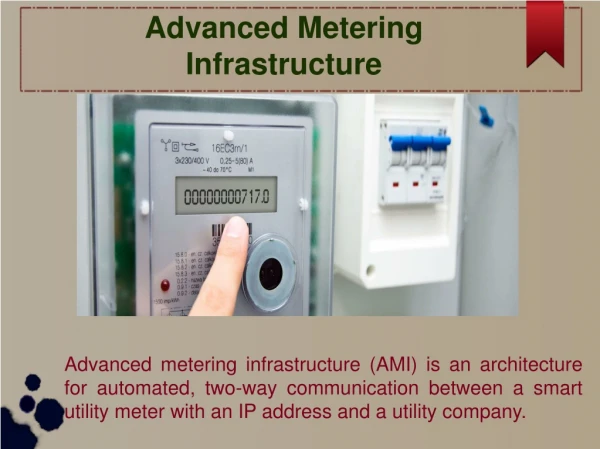
Advanced Metering Infrastructure (AMI) Project Update. Mark Heintzelman June 2010. AMI System Requirements Demonstrated Ability @ Scale. Retrieve hourly energy consumption from all (480,000) endpoints Two-way communications to reset displayed Peak Demand or kW, on command

E N D
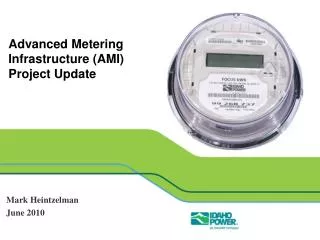
Advanced Metering Infrastructure (AMI) Project Update Mark Heintzelman June 2010
AMI System RequirementsDemonstrated Ability @ Scale • Retrieve hourly energy consumption from all (480,000) endpoints • Two-way communications to reset displayed Peak Demand or kW, on command • Two-way communications to support direct load control • Meet NIST – Critical Infrastructure Protection requirements • Provide outage management process enhancements • Reduce operational costs related to meter reading and customer movement processes
AMI Phased Approach • Phase I – Test the AMI technology – 2004 -2008 • Test hourly data retrieval • Pilot Data Management & time variant pricing • Develop a business case • Phase II – AMI Infrastructure Installation 2009- 2011 • Strategic Sourcing • Regulatory Filing • Infrastructure deployment • O&M cost reduction • Phase III – AMI Full Implementation 2012 • Full data and system integration • System optimization • Additional Systems
TWACS Modules • Meter applications • New Solid-state Meters with factory installed TWACS modules • Residential - Landis & Gyr • Commercial – General Electric • Transponder Switch (outdoor) • AC Cycling/Irrigation Load Control • Control circuit • 30 Amp Direct • water heater/pool pump
Outbound Bit V1 V2 TA TB Inbound Bit 1 3 5 7 2 4 6 8 TWACS PLC Communications Outbound Communication From Distribution Substation Inbound Communication From TWACS Module
Residential Meter Display • Scrolling (3) – Display Check - Peak Demand - kWh • “PD” Peak-Demand OO . OO (08.12 or 20.11 or 00.95) • Power Indicator/disc emulator (forward > Reverse <) • Com Indicator (not used) • Nominal Voltage (on)
Deployment Status • 60+ Sub Stations Complete • 260,000 meters exchanged – 750-1,000 per day • MDMS IEE 5.3 in production • On Schedule • On Budget • PUC Actions • Certificate of Necessity & Convenience (Dec 2008) • Recovery on investment (June 2009 – June 2012) • DOE Stimulus Grant $47 M for Phase III
Added Value • Billing Error & High Bill complaint reductions • Customer Satisfaction • Access issues, Digital meters, Data availability - Web • Enhance DSM (Green) • Enable Time Variant Rates (Green) • Enhanced C2T/GIS/OMS data • Reduction In Vehicle Use (Green) • Distribution Control? – Capacitors? • System Monitoring & Reporting/Data Acquisition • Voltage, Load, PQ, Energy use, Outage, Electrical location
Data Volume • Monthly reading of 500,000 meters X 12 months = 6,000,000 meter reads annually • 250,000 AMI meters X 26 reads daily = 6,500,000 meter reads daily (24 hourly reads + daily kWh & kW reads = 26 reads daily) • 500,000 AMI meters X 26 reads daily = 13,000,000 meter reads daily • 13,000,000 daily reads X 365 = 4,745,000,000 meter reads annually • Additional reads (future) • Voltage • Power Quality • Transponder cycle counts • Meter Data Management System (MDMS) – Bleeding edge
Hard AMI Cost Reductions(the business case) • 99% of Meter Reading Costs ($5.5M annually) • 90% of Customer Movement Costs ($1.5M annually) • Reduction in outage scoping & restoration conformation costs ($363k annually)
Approximate Cost • 3 Years • $74,000,000 • $1.2M - IT – Systems & Interfaces • $13.3M - 142 Station + growth & Communications Equipment Installed • $55.5M – 500,000 Meters Exchanged or installed • 10% contingency and loading • $126 to $140 per endpoint
AMI Phase III (2012) • Implementation of “Mass” Time-Variant-Rates, this will require additional investment (CIS) (stimulus) • DSM Implementation (stimulus) • Direct load control • Indirect load reduction – price signals - TOU • Data analysis • Other Value Added Services (stimulus) • Monitoring • Reporting • Control