Download
1 / 32
320 likes | 418 Views
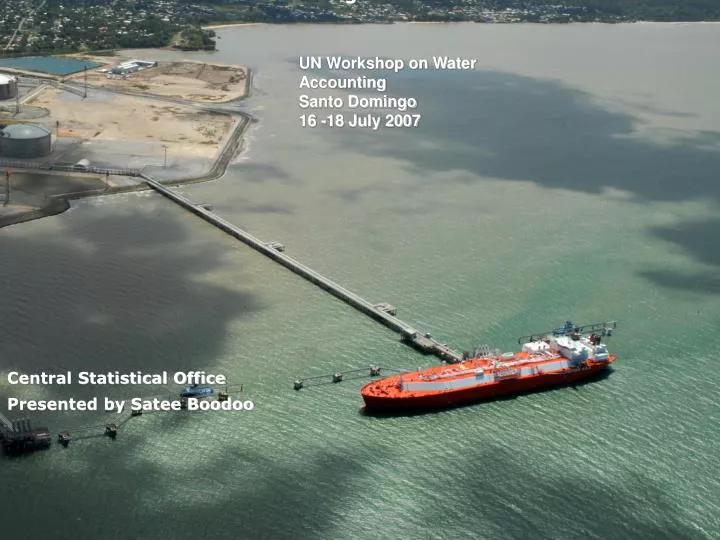
Water in Trinidad and Tobago. UN Workshop on Water Accounting Santo Domingo 16 -18 July 2007. Central Statistical Office. Presented by Satee Boodoo. MACRO ECONOMIC INDICATORS. Population 1.3 million 2006 Projections Nominal GDP 18.2 Billion US $

E N D
Water in Trinidad and Tobago UN Workshop on Water Accounting Santo Domingo16 -18 July 2007 Central Statistical Office Presented by Satee Boodoo Source:UWI**********************************
MACRO ECONOMIC INDICATORS • Population 1.3 million 2006 Projections • Nominal GDP 18.2 Billion US $ • Real GDP Growth 12.0% • Unemployment Rate 6.2% • Exchange Rate – 6.28 to 1 US $
Maracas Beach – Trinidad Rainfall Patterns in Trinidad and Tobago
Ministries Finance Health Public Utilities Works and Transport Agriculture - Land & Water, Forestry, Fisheries, Extension Planning and Development Energy National Security Others Environmental Management Authority Municipal Corporations Tobago House of Assembly Water Resources Agency WASA Institutions Involved in Water Management
CURRENT - $’000 TT 2002 53,206.1 2003 119,149.5 2004 175,813.5 2005 97,704.1 2006 111,019.6 CONSTANT - $’000TT 2002 181,369.4 2003 198,303.0 2004 209,041.6 2005 215,030.2 2006 189,501.5 Value Added of Water Supply Industry in Trinidad and Tobago
Renewable Freshwater Resources Precipitation 12,084 Actual Evapotranspiration 8,016 Internal Flow 4,067 Renewable Freshwater 4,067 resources Water Use Balance Gross Freshwater Abstracted = Net Freshwater Abstracted: 345 Leakage during transport 196 Basic Water Statistics in 2005(mio m3 /year)
Water Supply Industry – 2005(mio m3 /year) • Gross Freshwater delivered by Supply Industry 354 • Freshwater losses during transport 196 • Net Freshwater delivered by water supply Industry of which: Households 179 Agriculture, Forestry and Fishing 5 Manufacturing 36
Total Water Use 2005 (mio m3 /year) Total Freshwater Use 179 of which used by: Households 155 Agriculture, Forestry and Fishing 10 Manufacturing 53
Clean Perturbed Polluted Agri Commercial/ Industrial/Residential Swamp /Reservoir Water Intake or Extraction point Grassland Forest Town Disturbed natural ecosystem Roads Pitch Lake Physio-Chemical Surface Water QualityinTrinidad
Clean Perturbed Polluted Agriculture Commercial/Industrial/Residential Swamp /Reservoir Water Intake or Extraction point Grassland Forest Town Disturbed natural ecosystem Roads Pitch Lake Heavy Metals in Surface Waters of Rivers in Trinidad
Clean Perturbed Polluted Agriculture Commercial/Industrial/Residential Swamp /Reservoir Water Intake or Extraction point Grassland Forest Town Disturbed natural ecosystem Roads Pitch Lake Heavy Metals in the Sediments of Rivers of Trinidad
AREA OF CONCERN • Source: An Assessment of the Vulnerability of Trinidad to Oil and hazardous Substance Spills • using an Environmental Vulnerability Index.-Austin J.G.M.S.c Thesis, University of the West Indies 2001
Section 18 (I) of the Waterworks and Water Conservation Act Chap. 54:41 ( Rev. 1980) Section 73 of the Summary Offence Act Chap. 11:02 (Rev. 1980) Section 53 of the Water and Sewerage Act Chap. 54:40 (Rev. 1980) Sections 60F, G, H, I of the Public Health Ordinance Chap. 12:04 (Rev. 1980) Section 29(1)(1) of the Petroleum Act Chap. 62:01 (Rev. 1980) Environmental Management Act (2000) Sections 52-54 Draft Water Pollution Rules 2001 Prohibits pollution of watercourses Pollution generally of rivers Prohibits pollution of waters Provision for the protection of the public from polluted water Water pollution regulations for the petroleum industry Authority to establish legal regime for management of water pollution. Sets our regime for dealing with water pollution Establishes the regime for dealing with water pollution. Water Laws in Trinidad and Tobago
WASA / Canadian Consult. started on 18th April, 2007 Some Goals: • Develop a Draft water supply and wastewater policy. • Forecast water demands and flows for residential, industrial, agricultural and institutional components. • Investigate and document operational and institutional issues and system deficiencies. • Evaluate non-conventional water supply sources –reclaimedwastewater effluents, desalination, treated wastewater effluent. • Incorporate linkages to other relevant studies e.g. Engineer’s Report, Maintenance Management System, Organizational Update, Asset and Data Management, National Physical Development Plan. • Incorporate the requirements of the RIC and EMA. • Provide a high level assessment of Municipalities water and wastewater infrastructure assets. • Reviewing supply / treatment redundancy in the water and wastewater treatment facilities and water distribution and wastewater collection. • Recommend a 10 year capital program of term visions for both water and wastewater systems. • Incorporating the engineering outputs into a financial analysis for evaluation of the fiscal impacts of the developed 10 yr capital program.
Sources of Information • Central Statistical Office –National Income, Economic Statistics, CSSP, Environmental Stakeholders Meetings • Water and Sewage Authority; Public Consultation meeting • Water Resources Agency • FAO WATER at a glance • Meteorological Office – T &T • University of the West Indies, St Augustine, M.Sc Thesis, CLEAR maps • International Institute for Applied Systems Analysis, Austria; Integrated Water Resource Management in T&T, Sharda Maharaj • EMA-Pollutant Inventory Study, Legal Department • Report of the Sub-Committee on the Environment-Ministry of Planning and Development • Atlantic LNG –Photo on Slide 1 • Photos: Satee Boodoo – June 2007 –Slides 7, Slide 22
THE END YOU NEVER MISS THE WATER T’ILL THE WELL RUNS DRY Source: Old English Proverb