Download
1 / 7
70 likes | 152 Views
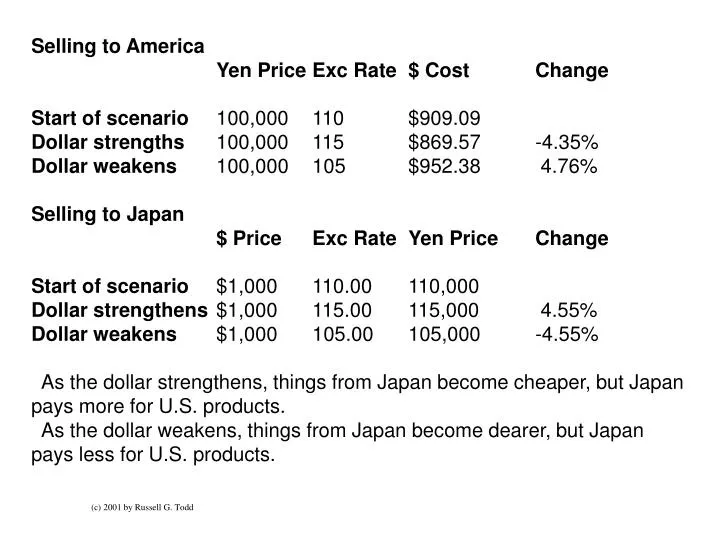
Selling to America Yen Price Exc Rate $ Cost Change Start of scenario 100,000 110 $909.09 Dollar strengths 100,000 115 $869.57 -4.35% Dollar weakens 100,000 105 $952.38 4.76% Selling to Japan $ Price Exc Rate Yen Price Change

E N D
Selling to America Yen Price Exc Rate $ Cost Change Start of scenario 100,000 110 $909.09 Dollar strengths 100,000 115 $869.57 -4.35% Dollar weakens 100,000 105 $952.38 4.76% Selling to Japan $ Price Exc Rate Yen Price Change Start of scenario $1,000 110.00 110,000 Dollar strengthens $1,000 115.00 115,000 4.55% Dollar weakens $1,000 105.00 105,000 -4.55% As the dollar strengthens, things from Japan become cheaper, but Japan pays more for U.S. products. As the dollar weakens, things from Japan become dearer, but Japan pays less for U.S. products. (c) 2001 by Russell G. Todd
Interpreting Forex Figures • USD/JPY; USD/CHF; USD/CAD • Yen per dollar, Swiss franc per dollar, Canadian dollars per dollar • High figure = strengthening U.S. dollar, weakening foreign currency • Dollar strengthened to 95 yen from 94.5 yen. • Dollar can buy more yen; yen can buy fewer dollars.
Interpreting Forex Figures • EUR/USD; GBP/USD; AUD/USD; NZD/USD • US$ per euro; US$ per pound; US$ per Aussie $; US$ per Kiwi $ • Higher figure = weakening US dollar • Dollar weakened from 1.44 pounds to 1.45 pounds. • Pound can buy more dollars; dollar can buy fewer pounds.
“Cross Rates” • Comparing currencies other than US$ • EUR/JPY = yen per euro • Higher figure = stronger euro, weaker yen • Lower figure = weaker euro, stronger yen • Pound strengthened to 120.72 yen from 120.11 yen a day earlier. • Pound can buy more yen; yen can buy fewer pounds.
The Yuan • USD/yuan = yuan per US dollar • Higher figure = stronger dollar, weaker yuan • Dollar weakened marginally to 6.8358 yuan from 6.8367 a day earlier • Dollar can buy a little less yuan
The rule • If USD is on the left side, higher number equals stronger dollar • Means other currency per dollar • If USD is on the right side, lower number equals stronger dollar • Means dollars per other currency • Why so confusing? Maybe so the pros have an edge?!