Download
1 / 4
0 likes | 15 Views
Ways to Gain Insights into specialization working on data analyst course projects

E N D
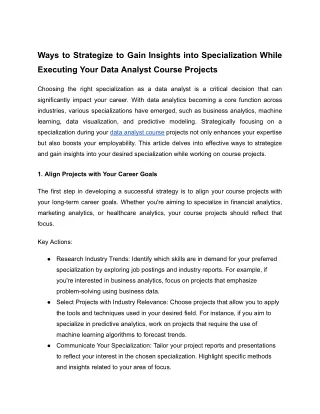
Ways to Strategize to Gain Insights into Specialization While Executing Your Data Analyst Course Projects Choosing the right specialization as a data analyst is a critical decision that can significantly impact your career. With data analytics becoming a core function across industries, various specializations have emerged, such as business analytics, machine learning, data visualization, and predictive modeling. Strategically focusing on a specialization during your data analyst course projects not only enhances your expertise but also boosts your employability. This article delves into effective ways to strategize and gain insights into your desired specialization while working on course projects. 1. Align Projects with Your Career Goals The first step in developing a successful strategy is to align your course projects with your long-term career goals. Whether you're aiming to specialize in financial analytics, marketing analytics, or healthcare analytics, your course projects should reflect that focus. Key Actions: ● Research Industry Trends: Identify which skills are in demand for your preferred specialization by exploring job postings and industry reports. For example, if you're interested in business analytics, focus on projects that emphasize problem-solving using business data. ● Select Projects with Industry Relevance: Choose projects that allow you to apply the tools and techniques used in your desired field. For instance, if you aim to specialize in predictive analytics, work on projects that require the use of machine learning algorithms to forecast trends. ● Communicate Your Specialization: Tailor your project reports and presentations to reflect your interest in the chosen specialization. Highlight specific methods and insights related to your area of focus.
By aligning your projects with your career goals, you ensure that the work you do in your data analyst course prepares you for real-world challenges in your chosen field. 2. Leverage Course Resources and Faculty Expertise Most data analyst courses offer a wealth of resources, including access to experienced faculty members, academic literature, and project case studies. These resources can play a pivotal role in helping you strategize and gain insights into your specialization. Key Actions: ● Seek Guidance from Faculty: Approach instructors who have expertise in your desired specialization for guidance. They can provide valuable feedback, suggest advanced tools, and direct you toward resources that deepen your understanding. ● Access Advanced Course Materials: Many courses provide access to additional readings, tutorials, and case studies that cover specialized areas. Take advantage of these resources to expand your knowledge base in areas like data visualization or machine learning. ● Collaborate with Peers: Often, group projects are part of a data analyst course. Use these opportunities to collaborate with peers who have similar specialization interests. By working together, you can exchange knowledge and develop a more comprehensive understanding of your chosen field. By utilizing course resources and collaborating with instructors and peers, you can refine your strategy and focus on specialization areas that are relevant to your career objectives. 3. Utilize Real-World Data in Projects One of the best ways to gain insights into a specialization is by working with real-world data that mirrors industry applications. This approach offers practical experience and deepens your understanding of how analytics is applied in specific industries.
Key Actions: ● Source Industry-Specific Datasets: Choose projects that use real-world datasets related to your specialization. If you're interested in healthcare analytics, for example, find publicly available datasets that provide insights into patient care, clinical trials, or hospital performance. ● Apply Domain-Specific Techniques: Use tools and methodologies that are relevant to your specialization. For example, if you're focusing on financial analytics, work on projects that require risk assessment, portfolio optimization, or fraud detection techniques. ● Explore Open Data Sources: Many governments and organizations make their data available to the public. Use platforms like Kaggle or Data.gov to find relevant datasets that allow you to simulate real-world scenarios in your specialization. Working with real-world data can make your data analytics course projects more meaningful and give you practical insights into your chosen specialization. 4. Focus on Data Visualization to Illustrate Insights Data visualization plays a critical role in turning raw data into actionable insights, regardless of the field you're specializing in. Mastering the art of data visualization will not only enhance your project outcomes but also improve your ability to communicate complex findings to stakeholders. Key Actions: ● Choose the Right Visualization Tools: Depending on your specialization, different visualization tools may be required. If you're interested in marketing analytics, for instance, mastering tools like Tableau, Power BI, or Google Data Studio will help you present consumer insights effectively. ● Create Specialized Dashboards: Building interactive dashboards tailored to your area of specialization allows you to present key metrics and trends clearly. For
example, if you're focusing on supply chain analytics, create a dashboard that highlights inventory turnover, shipping delays, or customer demand forecasts. ● Visualize Complex Data Patterns: In fields like machine learning or predictive analytics, data can become highly complex. Use visualization techniques like heatmaps, scatter plots, and time-series graphs to uncover patterns in large datasets. Data visualization is a key skill for any data analyst, and mastering it within the context of your specialization can give you an edge when applying for jobs or presenting project results. Conclusion Strategizing to gain insights into your data analyst specialization while executing course projects is a thoughtful process that requires alignment with your career goals, utilization of course resources, and practical application of real-world data. By focusing on data visualization, collaborating with faculty and peers, and continuously seeking feedback, you can ensure that your course projects not only strengthen your understanding of data analytics but also prepare you for a successful career in your chosen specialization. ExcelR — Data Science, Data Analyst Course in Vizag Address: iKushal, 4th floor, Ganta Arcade, 3rd Ln, Tpc Area Office, Opp. Gayatri Xerox, Lakshmi Srinivasam, Dwaraka Nagar, Visakhapatnam, Andhra Pradesh 530016 Mobile number: 7411954369