Download
1 / 14
140 likes | 141 Views
Coronavirus Semiconductor Sales Watch: Twelve-weeks in, the impact of COVID-19 on the semiconductor market since the WHO declared the emergency looks to be mostly abated. IC ASPs have stayed near the average of other crises

E N D
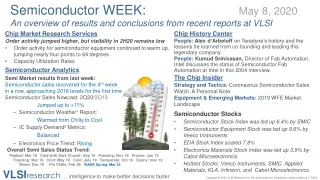
Semiconductor WEEK: May 8, 2020 An overview of results and conclusions from recent reports at VLSI Chip Market Research Services Order activity jumped higher, but visibility in 2H20 remains low • Order activity for semiconductor equipment continued to warm up, jumping nearly four points to 64 degrees • Capacity Utilization Rates Semiconductor Analytics Semi Market results from last week: Semiconductor sales recovered for the 4thweek in a row, approaching 2018 levels for the first time Semiconductor Sales Nowcast: 2Q20/2Q19 Jumped up to +11% – Semiconductor Weather1Report: Warmed from Chilly to Cool – IC Supply-Demand2Metrics: Balanced – Electronics Price Trend: Rising Overall Semi Sales Status Trend: Peaked: Mar 18 Cold with Dark Clouds: Sep 18 Freezing: Nov 18 Frozen: Jan 19 Freezing: Mar 19 Cold: May 19 Cool: July 19 Temperate: Oct 19 Sunny: Nov 19 Warm: Dec 19 Flu Chills: Feb 28 WAHE Spring: Mar 25 Chip History Center People: Alex d’Arbeloff on Teradyne’s history and the lessons he learned from co-founding and leading this legendary company. People: Kumud Srinivasan, Director of Fab Automation, Intel discusses the status of Semiconductor Fab Automation at Intel in this 2004 interview. The Chip Insider Strategy and Tactics: Coronavirus Semiconductor Sales Watch. A Personal Note. Equipment & Emerging Markets: 2019 WFE Market Landscape Semiconductor Stocks • Semiconductor Stock Index was led up 6.4% by SMIC • Semiconductor Equipment Stock was led up 9.6% by Veeco Instruments • EDA Stock Index soared 7.8% • Electronics Materials Stock Index was led up 3.9% by Cabot Microelectronics • Hottest Stocks: Veeco Instruments, SMIC, Applied Materials, KLA, Infineon, and Cabot Microelectronics. VLSIresearch … intelligence to make better decisions faster Copyright © 2020 VLSI Research Inc. All rights reserved. Distribution rights contained in T&Cs.
The Chip Insider®'s Graphics File April 2020 Order activity jumped higher, but visibility in 2H20 remains low • Order activity for semiconductor equipment continued to warm up, jumping nearly four points to 64 degrees • With sales falling more than 8% sequentially in Q1, equipment market is primed for a strong bounce back in Q2 • Equipment sales are expected to increase sequentially by mid-single digits in Q2 as additional revenue is recognized from shipments in Q1 and also from strong demand from China • This is a big sigh of relief for the equipment market in Q2 especially when compared to our negative forecast for Q2 • Despite the improvement, we are not out of the woods yet • Electronics sales under pressure in 1H20 This issue contains the latest forecast. VLSIresearch … intelligence to make better decisions faster Call us to access more details Copyright © 2020 VLSI Research Inc. All rights reserved. Distribution rights contained in T&Cs.
Mild COVID-19 impact, recovery 3Q20--VLSI Forecast Forecast as of March 2020: Semi Equipment ($B): Sequential Change Capacity Utilization: ICs ($B): Sequential Change IC Units (BU): Sequential Change Electronics ($B) : Sequential Change 2021 84.9 $ 17.6% 89.1% 418.0 $ 24.0% 342.1 20.1% 2,362 $ 16.9% 2019 $ -8.0% 84.6% 352.3 $ -13.4% 299.4 -6.0% 2,122 $ -2.0% 2020 72.2 $ -6.3% 82.9% 337.1 $ -4.3% 284.9 -4.9% 2,020 $ -4.8% 77.0 Moderate COVID-19 impact, recovery in 4Q20 Forecast as of March 2020: Semi Equipment ($B): Sequential Change ICs ($B): Sequential Change IC Units (BU): Sequential Change Electronics ($B) : Sequential Change Severe COVID-19 impact, recovery 1Q21 Forecast as of March 2020: Semi Equipment ($B): Sequential Change ICs ($B): Sequential Change IC Units (BU): Sequential Change Electronics ($B) : Sequential Change 2021 84.9 $ 33.9% 418.0 $ 37.9% 342.1 34.1% 2,362 $ 25.3% 2021 84.9 $ 52.4% 418.0 $ 48.1% 342.1 43.7% 2,362 $ 35.8% 2019 $ -8.0% 352.3 $ -13.4% 299.4 -6.0% 2,121.9 $ -2.0% 2020 63.4 $ -17.7% 303.1 $ -14.0% 255.1 -14.8% 1,885 $ -11.2% 2019 $ -8.0% 352.3 $ -13.4% 299.4 -6.0% 2,122 $ -2.0% 2020 55.7 $ -27.7% 282.2 $ -19.9% 238.1 -20.5% 1,739 $ -18.0% 77.0 77.0 VLSIresearch … intelligence to make better decisions faster Copyright © 2020 VLSI Research Inc. All rights reserved. Distribution rights contained in T&Cs.
The Chip Insider®Graphics Capacity Utilization Rates: • Utilization rates remain low due to overcapacity Capacity Utilization Rates: chart gives rolling averages for semiconductor wafer fab, test, and assembly VLSIresearch … intelligence to make better decisions faster Copyright © 2020 VLSI Research Inc. All rights reserved. Distribution rights contained in T&Cs.
Semiconductor Analytics Last Week in the Semiconductor Market: Semiconductor sales recovered for the 4thweek in a row, approaching 2018 levels for the first time, as the 2nd half production ramp kicked in. The 2Q20 Nowcast continued to improve with NAND and Logic doing much better than expected in March and April. W/W: Week-over-Week sequential growth W/Q: Week-over-Quarter W/Y: Week-over-Year Semiconductor Sales Nowcast: 2Q20/2Q19 Jumped to +11% Semiconductor Weather1Report: 65˚ F Warmed from Chilly to Cool IC Supply-Demand2Metrics: Balanced Electronics Pricing Trend: Rising Notebooks, Smartphones, and Consumer Electronics have a seasonal inversion driven by WAHE (Work-at-Home Economy) Thank you for supporting us through this last issue of 2018. Semiconductor Analytics will return January . Overall Semi Sales Status Trend: Peaked: Mar 18 Cold with Dark Clouds: Sep 18 Freezing: Nov 18 Frozen: Jan 19 Freezing: Mar 19 Cold: May 19 Cool: July 19 Temperate: Oct 19 Sunny: Nov 19 Warm: Dec 19 Flu Chills: Feb 28 WAHE Spring: Mar 25 1: Measures Order Activity 2: Measures Pricing Power VLSIresearch … intelligence to make better decisions faster 5 Copyright © 2020 VLSI Research Inc. All rights reserved. Distribution rights contained in T&Cs.
2020 Semiconductor Market Drivers Coronavirus has driven Integrated Circuit sales towards recession: • Certainties: – Coronavirus Pandemic infected economies • Unparalleled Supply and Demand shocks to IC sales of <10% and units of ~20% – Macroeconomic ‘V’acuum or ‘U’ – not ‘L’ – WAHE (Work-At-Home Economy) – 7/10nm and 5/7nm demand ramps – Memory Price Elasticity – 5G: Smartphone, Auto, Industrial • Uncertainties: – Ability of Governments to defibrillate economy out of shelter-in-place – 2020 Elections in U.S. VLSIresearch … intelligence to make better decisions faster 6 Copyright © 2020 VLSI Research Inc. All rights reserved. Distribution rights contained in T&Cs.
The Chip Insider® Strategy & Tactics Strategy and Tactics: Coronavirus Semiconductor Sales Watch. A Personal Note. Summaries: A Personal Note … Coronavirus Semiconductor Sales Watch: Twelve-weeks in, the impact of COVID-19 on the semiconductor market since the WHO declared the emergency looks to be mostly abated. IC ASPs have stayed near the average of other crises. IC Sales and unit shipments are outperforming past crises, reflecting what should be a recovery year. Still, this does not measure the impact of government and state policy decisions that have hit the economies of the world. What we do know is that China's 1Q2020 GDP crashed… More recently, the United States’ first quarter GDP fell as well. Of more concern was Government Expenditures crawling up a mere 0.7%, reflecting the Government’s stimulus speed running at a Banana Slug’s pace (This is an insult to a Banana Slug). However, this does not mean electronics is hurting as bad as other durable goods. VLSI continues to hold that the WAHE (Work At Home Economy) is supporting end- demand for semiconductors, which was confirmed… as for IC Inventories … ChipChirps™ Facts from the Far Side ... ChipChirps™ are short notifications from VLSI’s analysts to alert clients about breaking news and events. They are exclusively available on VLSI’s App for Android and iOS. “What you do in life echoes in eternity” — From the Movie “The Gladiator” Contact us to get the full report and more VLSIresearch … intelligence to make better decisions faster Copyright © 2020 VLSI Research Inc. All rights reserved. Distribution rights contained in T&Cs.
The Chip Insider® Equipment & Emerging Markets 2019 WFE Market Landscape • KLA, HHT, ASMI, and Nikon grew in a challenging year • Overall WFE results • Company positions • WFE competitive landscape • Plasma CVD • Metal CVD • PVD • Epitaxy • S/W ALD • Batch (Tube) Dep. Etch CMP Ion Implant • • • • VLSI’s View VLSIresearch … intelligence to make better decisions faster Copyright © 2020 VLSI Research Inc. All rights reserved. Distribution rights contained in T&Cs.
Memory Pull Back Impacted All Strong position in Logic/Foundry helped ASML, KLA, HHT, ASMI, and Nikon VLSIresearch … intelligence to make better decisions faster 9 Copyright © 2020 VLSI Research Inc. All rights reserved. Distribution rights contained in T&Cs.
semiStockWEEK: VLSI's Semiconductor Stock Indices jumped this week along with the market. EDA index hit a fresh new yearly high. Semiconductors 6%, Equipment 10%, EDA 8%, Electronic Materials 4%. VLSIresearch … intelligence to make better decisions faster Copyright © 2020 VLSI Research Inc. All rights reserved. Distribution rights contained in T&Cs.
Semiconductor Stocks: Weekly Growth and Forward P/E Ratios by Company VLSI’s Semiconductor Stock Index was led up 6.4% by SMIC and Infineon. IDM +5.0% Foundry & OSAT +7.5% Fabless & Fablite +6.3% Weekly Gains 5/8/2020 Price Change Price Change Forward P/E Forward P/E Semiconductor Stocks Semiconductor Stocks IDM Intel Fab-lite to Fabless AMD 3.8% 12 6.6% 35 Micron 10 Analog Devices 6.0% 21 7.1% ON Semiconductor 11 Broadcom 5.9% 12 13.2% AMD AMDAnalog Devices ADIAmkorAMKR ASE ASXBroadcom AVGOIBMIBM Infineon IFNNY.PK Intel INTCJCET600584.SS Kingpak Technology6238.TWO Micron Technology MU On Semiconductor ONPanasonic PC MagnaChip Semiconductor MXMaxim MXIM MaxLinear MXLMediaTek 2454.TW NVIDIA NVDAQualcomm QCOM Samsung Electronics 005930.KS Silicon Laboratories SLABSkyworks SWKS SMIC SMI STMicroelectronics STM Texas Instruments TXNTSMC TSMUMC UMCWestern Digital WDCXilinx XLNX Samsung Electronics SK hynix -2.4% 1.6% IBM Infineon 0.9% 13.8% 10 18 – STMicroelectronics Western Digital Foundry & OSAT Amkor ASE JCET Kingpak Technology 2.6% 9.2% 20 7 MagnaChip Semiconductor Maxim MaxLinear MediaTek NVIDIA Panasonic Qualcomm 6.9% 4.0% 7.0% -0.8% 10.5% 2.3% 6.5% 13 25 24 – 34 31 14 4.1% 8.2% 6.1% 10.3% 13 12 84 – SMIC TSMC UMC 1704 17 14 Silicon Laboratories Skyworks Texas Instruments Xilinx 31 16 24 26 15.0% 3.5% 5.6% 9.2% 12.5% 4.8% 4.7% VLSIresearch … intelligence to make better decisions faster Copyright © 2020 VLSI Research Inc. All rights reserved. Distribution rights contained in T&Cs.
Chip Equipment & Related Stocks: Weekly Growth and Forward P/E Ratios by Company VLSI’s Semiconductor Equipment Stock Index was led up 9.6% by Veeco Instruments, Applied Materials, and KLA. WFE +11.0% Test +10.9% Assembly +5.3% Weekly Gains 0 5/8/2020 Price Change Price Change Forward P/E Forward P/E Equipment Stocks Equipment Stocks Wafer Process: Applied Materials ASM International ASML KLA Test: Advantest Teradyne FormFactor 12 18 28 17 14.8% 2.9% 9.1% 14.1% 7.9% 12.5% 12.3% – 18 22 Applied Materials AMAT Advantest ATEYY ASM International ASMI ASM Lithography ASML ASM Pacific 0522.HK BE Semiconductor BESIY.PK FormFactorFORMKLA KLAC Kulicke & Soffa KLIC Lam Research LRCX Onto Innovation ONTONikon 7731 Teradyne TER Tokyo Electron Limited 8035 Veeco VECO Lam Research Onto Innovation 15 – Assembly: BESI 12.9% 9.1% 4.6% – Nikon TEL 1.1% 3.8% Kulicke & Soffa ASM Pacific Technology 6.4% 4.9% 14 – – Veeco Instruments 15 31.0% VLSIresearch … intelligence to make better decisions faster Copyright © 2020 VLSI Research Inc. All rights reserved. Distribution rights contained in T&Cs.
Electronic Materials Stocks: Weekly Growth and Forward P/E Ratios by Company VLSI’s EDA Stock Index soared 7.8%, hitting a fresh new high for the year. Weekly Gains EDA & Electronic Materials Stocks 5/8/2020 Price Change Price Change EDA & Electronic Materials Stocks Forward P/E Forward P/E VLSI’s Electronics Materials Stock Index was led up 3.9% by Cabot Microelectronics. EDA Cadence DNP DuPont 1.4% 4.1% – 4 31 8.7% BASF BASFY Cadence CNDS DNP 7912 JSR 4185 SOI.PA Synopsys SNPS Cabot Microelectronics CCMP DuPont DD Shin-Etsu 4063 SOITEC Tokyo Ohka 4186 Synopsys Electronic Materials BASF Cabot Microelectronics 27 JSR Shin-Etsu SOITEC Tokyo Ohka -0.9% 4.6% 6.7% 1.5% 7.0% – – – – 0.6% 13.5% 2 18 VLSIresearch … intelligence to make better decisions faster Copyright © 2020 VLSI Research Inc. All rights reserved. Distribution rights contained in T&Cs.
Companies Companies Max Growth Weekly Growth VLSI’s Indices of Chip Industry Stocks Min Growth Range of S&P 500 S&P 500 The Prior Week's Close Growth Growth Down Up Semi Stocks Equipment Stocks Materials Stocks EDA Stocks Semi Stocks Equipment Stocks Materials Stocks EDA Stocks 04-Oct-19 11-Oct-19 18-Oct-19 25-Oct-19 01-Nov-19 08-Nov-19 15-Nov-19 22-Nov-19 29-Nov-19 06-Dec-19 13-Dec-19 20-Dec-19 27-Dec-19 03-Jan-20 10-Jan-20 17-Jan-20 24-Jan-20 31-Jan-20 07-Feb-20 14-Feb-20 21-Feb-20 28-Feb-20 06-Mar-20 13-Mar-20 20-Mar-20 27-Mar-20 03-Apr-20 10-Apr-20 17-Apr-20 24-Apr-20 01-May-20 08-May-20 84.6 86.0 86.2 88.2 90.3 91.7 92.0 90.0 90.9 92.6 96.7 99.2 100.0 100.3 101.5 104.7 106.1 98.4 102.5 106.5 103.7 93.1 91.8 81.1 69.6 78.3 77.1 85.6 89.1 88.7 89.1 94.8 84.4 86.4 86.7 92.4 92.6 94.9 97.0 92.0 93.7 94.7 98.0 99.9 100.0 100.2 100.9 104.8 105.1 98.4 101.3 106.6 99.3 90.4 91.0 78.3 65.2 78.7 73.4 84.0 88.4 86.1 83.9 91.9 93.1 95.0 97.5 100.0 101.2 103.2 101.5 98.7 96.7 95.5 100.0 100.1 100.0 98.9 99.2 101.0 100.5 96.0 100.4 101.0 98.1 85.5 84.8 71.0 67.0 76.6 72.6 82.6 82.7 82.5 85.0 88.4 96.0 96.0 94.5 94.9 94.8 96.1 97.6 95.9 100.1 95.5 96.9 99.6 100.0 100.5 104.7 106.4 107.8 103.8 107.2 114.2 106.4 96.2 95.1 90.7 78.4 88.7 89.9 99.7 111.3 111.9 107.5 115.9 1.1% 1.7% 0.2% 2.4% 2.4% 1.5% 0.4% -2.2% 1.0% 1.8% 4.5% 2.6% 0.8% 0.3% 1.2% 3.2% 1.3% -7.3% 4.2% 3.9% -2.6% -10.2% -1.5% -11.6% -14.2% 12.6% -1.6% 11.1% 4.0% -0.4% 0.5% 6.4% 1.1% 2.3% 0.3% 6.6% 0.2% 2.5% 2.1% -5.1% 1.8% 1.1% 3.5% 1.9% 0.1% 0.2% 0.7% 3.9% 0.3% -6.3% 2.9% 5.3% -6.9% -8.9% 0.6% -13.9% -16.7% 20.6% -6.7% 14.5% 5.2% -2.6% -2.6% 9.6% -0.8% 2.0% 2.7% 2.5% 1.3% 1.9% -1.6% -2.8% -2.0% -1.2% 4.7% 0.1% -0.1% -1.1% 0.2% 1.8% -0.5% -4.5% 4.6% 0.6% -2.8% -12.9% -0.7% -16.3% -5.7% 14.4% -5.3% 13.8% 0.2% -0.2% 3.1% 3.9% 1.4% 0.0% -1.5% 0.4% -0.1% 1.3% 1.6% -1.8% 4.4% -4.6% 1.5% 2.7% 0.4% 0.5% 4.2% 1.7% 1.3% -3.8% 3.3% 6.5% -6.9% -9.5% -1.2% -4.6% -13.6% 13.1% 1.4% 10.9% 11.7% 0.6% -4.0% 7.8% 34 35 28 46 36 37 31 7 37 33 48 39 29 23 32 45 29 3 45 47 6 0 18 0 3 52 14 54 41 17 27 52 10.1% 9.0% 11.2% 15.6% 9.9% 12.5% 10.8% 5.7% 5.0% 8.2% 10.7% 12.5% 5.9% 9.5% 7.2% 19.1% 14.9% 2.2% 21.4% 27.5% 4.5% -0.8% 7.9% -2.1% 15.3% 36.1% 17.4% 38.2% 17.0% 9.2% 19.1% 31.0% -20 -15 -23 -7 -15 -14 -20 -44 -14 -19 -3 -13 -23 -24 -22 -10 -25 -51 -10 -8 -49 -55 -35 -55 -52 -3 -41 -1 -10 -37 -28 -3 -3.5% -4.4% -6.0% -16.3% -12.1% -4.2% -5.0% -17.7% -15.0% -4.8% -1.4% -8.4% 2.7% -3.4% -4.8% -3.8% -10.8% -17.7% -11.7% -10.0% -17.1% -21.3% -11.0% -26.6% -28.9% -11.7% -15.1% -2.3% -6.1% -9.8% -11.9% -2.4% 13.6% 13.4% 17.2% 31.9% 22.0% 16.7% 15.8% 23.4% 20.0% 13.0% 12.1% 20.9% 8.6% 12.9% 12.0% 22.9% 25.7% 19.9% 33.1% 37.5% 21.6% 20.5% 18.9% 24.5% 44.2% 47.8% 32.5% 40.5% 23.1% 19.0% 31.0% 33.4% 91.1 91.7 92.2 93.3 94.7 95.5 96.3 96.0 96.9 97.1 97.8 99.4 100.0 99.8 100.8 102.8 101.7 99.5 102.7 104.3 103.0 91.2 91.7 83.7 71.1 78.4 76.8 86.1 88.7 87.6 87.4 90.4 -0.3% 0.6% 0.5% 1.2% 1.5% 0.9% 0.9% -0.3% 1.0% 0.2% 0.7% 1.7% 0.6% -0.2% 0.9% 2.0% -1.0% -2.1% 3.2% 1.6% -1.3% -11.5% 0.6% -8.8% -15.0% 10.3% -2.1% 12.1% 3.0% -1.3% -0.2% 3.5% VLSIresearch … intelligence to make better decisions faster Copyright © 2020 VLSI Research Inc. All rights reserved. Distribution rights contained in T&Cs.