Download

1 / 17
0 likes | 23 Views
Students looking for JMP assignment help with complete desperation consider Tutor Help Desk lifesaver for its outstanding assignment support along with helping them understand the complex stats by its experienced professionals.

E N D
Basics of Basics of Correlation Correlation Analysis in JMP Analysis in JMP jmp assignment help jmp assignment help www.tutorhelpdesk.com www.tutorhelpdesk.com
Introduction Introduction Correlation analysis is one of the basic statistical procedures used to examine the relationship between two or more variables. Knowing how variables are related can yield valuable insights applicable in various disciplines starting from economics to biology and engineering. JMP : It is one of the most commonly used statistical analysis software designed by SAS company and is very effective for performing correlation analysis. In this presentation, we will guide you through the basic steps of performing correlation analysis in JMP using “Auto MPG” dataset which is used to analyze the performance of a car depending on different attributes.
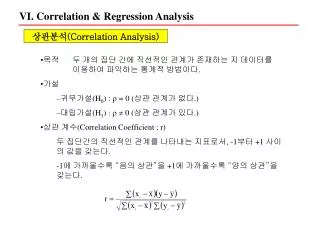
What is Correlation ? What is Correlation ? Before exploring the steps involved in JMP, let’s define what correlation is. In simple terms, correlation measures is the extent (in terms of direction and strength) to which 2 continuous variables are related linearly. The correlation coefficient, denoted as r, ranges from -1 to +1. qr = +1: A perfect positive linear relationship between variables. As one variable increases, the other increases as well. qr = -1: A perfect negative linear relationship. As one variable increases, the other decreases. qr = 0: No linear relationship between the variables. The closer the correlation coefficient is to +1 or -1, the stronger the linear relationship.
Getting Started Getting Started with JMP with JMP Software Software
JMP has friendly user interface for both beginners as well as professional users. For performing JMP has friendly user interface for both beginners as well as professional users. For performing correlation analysis, let us consider using the ‘Auto MPG’ dataset containing features such as MPG, correlation analysis, let us consider using the ‘Auto MPG’ dataset containing features such as MPG, number of cylinders, displacement and horsepower, weight, acceleration, year of manufacture and number of cylinders, displacement and horsepower, weight, acceleration, year of manufacture and country of origin. The data set can be either imported from JMP integrated data library or maybe country of origin. The data set can be either imported from JMP integrated data library or maybe downloaded from a data base such as the UCI Machine Learning Repository. downloaded from a data base such as the UCI Machine Learning Repository. Step 1: Load the Dataset Step 1: Load the Dataset 1.Open JMP and start a new project. 2.Go to File > Open and load the "Auto MPG" dataset, which should be in .jmp, .csv, or .xls format. Once the dataset is loaded, you will see all the variables in the data table.
Step 2: Overview of Step 2: Overview of the Data the Data After loading the data, spend some time to study the variables. The key attributes we will focus on for correlation analysis are: qMPG: Miles per gallon, a measure of fuel efficiency. qHorsepower: The power output of the vehicle. qWeight: The weight of the car. qAcceleration: The time taken for the car to accelerate from 0 to 60 mph.
Step 3: Exploring the Data with Step 3: Exploring the Data with Graph Builder Graph Builder Step 4: Launching Step 4: Launching the Correlation the Correlation Platform Platform Now, let us perform the actual correlation analysis: • Go to Analyze > Multivariate Methods > Multivariate. • In the dialog box, select the variables you want to include in the correlation analysis. For this example, we will select MPG, Horsepower, and Acceleration. • Click OK to generate the correlation matrix. Before performing the correlation, visualizing the data using JMP’s Graph Builder is helpful. See the steps below: • Click on Graph in the toolbar and select Graph Builder. • Drag and drop variables such as MPG, Horsepower, and Weight into the graph. This allows you to visually inspect potential relationships between variables. • For example, if you plot MPG against Horsepower, you might see an inverse relationship, indicating that as horsepower increases, MPG decreases. • Visualizing relationships give you some clarity on of how the correlation coefficients will behave. Weight,
STEP 5 Interpreting the Correlation Matrix Interpreting the Correlation Matrix Once the correlation matrix is generated, a table gets displayed that shows the correlation coefficients between all selected variables. Here's how to interpret the results: MPG and Horsepower: You might see a negative correlation, indicating that as horsepower increases, MPG decreases. This implies that cars having more powerful engines are less fuel-efficient. MPG and Weight: There will likely be a strong negative correlation, implying that heavier cars are less fule-efficient. Horsepower and Weight: These two variables may show a positive correlation, indicating that heavier cars usually have more powerful engines. Acceleration and MPG: There might be a weak positive or negative correlation, depending on the characteristics of the dataset.
Step 6: Visualizing Step 6: Visualizing Correlation with Correlation with Pairwise Plots Pairwise Plots JMP also facilitates you to view these relationships with the help of pairwise plots, which provide scatterplots for each pair of variables: 1.In the Multivariate dialog box, click on the red triangle next to the correlation matrix and select Pairwise Plots. 2.For each pair of variables, JMP will show scatterplots in order to visualize the relationship. For example, the scatterplot of MPG vs Weight will likely show a downward trend, consistent with the negative correlation observed in the matrix.
Advanced Options Advanced Options for Correlation in for Correlation in JMP JMP • Partial Correlation: To make adjustments on the effect of one or more variables, a partial correlation test is usually done. It can be accessed under the red triangle present in the basic window of Multivariate platform. • Non-linear Relationships: Although correlation analysis describes linear relations, JMP offers additional tools for analyzing non-linear relations as well. using the Fit Y by X feature you can fit different type of models such as polynomial and exponential fits.
Practical Example: Practical Example: Correlation Analysis Correlation Analysis Interpretation Interpretation
let’s interpret a hypothetical outcome from the correlation let’s interpret a hypothetical outcome from the correlation matrix: matrix: Variables Correlation Coefficient (r) MPG vs Weight -0.85 MPG vs Horsepower -0.78 MPG vs Acceleration 0.42 Horsepower vs Weight 0.79
from this matrix: from this matrix: • The negative correlation coefficient of -0.85 of MPG and Weight indicates that vehicles with higher weight have lower miles per gallon. • The negative coefficient calculated for MPG and Horsepower (-0. 78) corroborates the hypothesis that cars with physically powerful engines are less fuel efficient. • A moderate positive relationship between MPG and Acceleration (0. 42) could imply that cars with better acceleration or faster 0-60 times tend to get better MPG. • Lastly, the coefficients calculated for Horsepower and Weight wherein the coefficient of 0.79 shows that, in general, the weight does correlate with the power of the cars.
Benefits of JMP Benefits of JMP Assignment Help Assignment Help for Students for Students
Benefits of JMP Assignment Benefits of JMP Assignment Help for Students Help for Students JMP Assignment Help at Tutorhelpdesk.com is a lifesaver for students who are new to JMP or struggling with complex stats. Our service gives you expert guidance so you not only solve your assignments but also understand the underlying stats and software. By getting personalized help you can improve your skills in data visualization, hypothesis testing, regression and correlation analysis in JMP. Our service also provides step by step solutions so that you can try the steps in the software interface and generate the results yourself. Whether you are short on time or dealing with complex datasets, JMP Assignment Help ensures you complete your tasks accurately and on time. Ultimately this help boosts your confidence in using JMP and your overall academic performance and data analysis skills.
Recommended Textbooks Recommended Textbooks Applied Multivariate Statistical Analysis by Richard A. Johnson and Dean W. Wichern – This is a comprehensive book on multivariate statistics, with detailed coverage of correlation and other related topics. Statistics for Business and Economics by Paul Newbold, William L. Carlson, and Betty Thorne – A great resource for students looking to apply statistical methods in business contexts, including correlation analysis.
Thank Thank you very you very much! much! www.tutorhelpdesk.com hw@tutorhelpdesk.com hw@tutorhelpdesk.com +1 +1- -6178070926 6178070926