Download
1 / 21
0 likes | 10 Views
The Econometrics Assignment Help is specially evolved to enable students to understand the concepts of OLS regression and the R software fast. With the assistance of the Tutor Help Desk experts, students can have the knowledge in econometrics.

E N D
Automating OLS Regression Analysis in R Studio Econometrics Assignment Help Guide
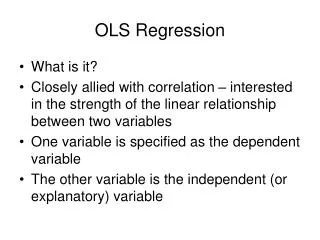
Introduction The Ordinary Least Squares (OLS) regression analysis is one of the fundamental econometric techniques used in establishing the nature of association between a dependent variable and one or more independent variables. For, students learning econometrics and R studio data analysis, mastery of OLS regression is very important. Performing this method manually could take a lot of time especially when dealing with big data or working with several models. This guide will further demonstrate how one can use automation in performing OLS regression in R Studio more specifically using the mtcars dataset.
01 Getting Started with R and R Studio
Before going in detail on automation the first and foremost thing need is the installation of R and Rstudio. R is mainly the programming language that is used for analyzing data, but Rstudio provides the an integrated development interface that makes it convenient for anyone to program in R. To install R and R Studio, follow these steps: 1. Download and Install R: Visit The Comprehensive R Archive Network (CRAN) and download the latest version of R for your operating system. 2. Download and Install R Studio: Visit the R Studio websiteand download the free R Studio Desktop version. Once you have both installed, open R Studio, and you’re ready to start coding.
02 Understanding the Basics of OLS Regression in R
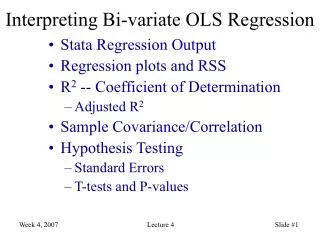
Before proceeding with the automation process, it’s essential to understand the basics of running OLS regression in R. The lm() function in R is used to fit linear models. The basic syntax of the lm() function is: lm(formula, data) • • formula: This describes the model to be fitted. For example, mpg ~ wt specifies that miles per gallon (mpg) is the dependent variable and weight (wt) is the independent variable. data: This denotes the dataset to be used for the model. Let us run a simple OLS regression with the mtcars dataset: # Load the mtcars dataset data(mtcars) # Fit a simple linear regressionmodel model <- lm(mpg ~ wt, data = mtcars) # Display the summary of the model summary(model) In the above example, we are predicting miles per gallon (mpg) based on the weight of the car (wt). The summary(model) function provides detailed results of the regression, including coefficients, R-squared values, and p-values.
03 Automating OLS Regression in R
While doing the homework or assignments, sometimes you may be required to carry out the multiple regression analysis or run certain models with multiple variables. There is much benefit to be had by automating this process. In the sections that follow, we will expand upon different strategies to automate regression analysis by using loops, functions and purrr package.
1. Automating with Loops Loops are one of the simplest methods to automate tasks in R. Lets take the example of running OLS regression for various sets of independent variables against mpg. To automate the process we can use loop. Here’s an example of automating OLS regression using a for loop: # Define the independent variables independent_vars <- c("wt", "hp", "qsec") # Create an empty list to store models models <- list() # Loop through each independent variable and run the regression for (var in independent_vars) { # Create the formula dynamically formula <- as.formula(paste("mpg ~", var)) # Fit the model model <- lm(formula, data = mtcars) # Store the model in the list models[[var]]<- model # Print the summary of the model print(summary(model)) } In this code: • We define a vector of independent variables (independent_vars). • We create an empty list (models) to store the regression models. • We loop through each independent variable, create a formula dynamically using paste(), fit the model using lm(), and store the results in the models list. This technique is useful when we want to run multiple models with various independent variables.
2. Automating with Functions Functions can be utilized for automating regression analysis that makes it more flexible and reusable. A function can be created by taking a dataset and a vector of independent variables as inputs to returns a list of models. Here’s how you can create such a function: # Function to automate OLS regression automate_regression <- function(data, dependent_var, independent_vars) { # Create an empty list to store models models <- list() # Loop through each independent variable and run the regression for (var in independent_vars) { # Create the formula dynamically formula <- as.formula(paste(dependent_var, "~", var)) # Fit the model model <- lm(formula, data = data) # Store the model in the list models[[var]]<- model }
# Return the list of models return(models) } # Define the independent variables independent_vars <- c("wt", "hp", "qsec") # Call the function models <- automate_regression(mtcars, "mpg", independent_vars) # Display summaries of the models lapply(models, summary) In this function: • automate_regression takes three arguments: data (the dataset), dependent_var (the dependent variable), and independent_vars (a vector of independent variables). • The function loops through each independent variable, fits the model, and stores it in the models list. • Finally, the function returns the list of models. You can use this function for any dataset and any combination of variables, making your code more modular and reusable.
3. Automating with the purrr Package The purrr package is part of the tidyverse and provides powerful tools for functional programming in R. First, install the purrr package if you haven’t already: install.packages("purrr") Now, let’s use purrr::map() to automate OLS regression: library(purrr) # Define the independent variables independent_vars <- c("wt", "hp", "qsec") # Create a function to fit a model fit_model <- function(var) { # Create the formula dynamically formula <- as.formula(paste("mpg ~", var)) # Fit the model lm(formula, data = mtcars) }
# Use map to apply the function to each independent variable models <- map(independent_vars, fit_model) # Name the models names(models) <- independent_vars # Display summaries of the models map(models, summary) Here’s what’s happening in the code: • • • We define a function fit_model() that fits a regression model based on the independent variable passed to it. We use map() from the purrr package to apply fit_model() to each independent variable in independent_vars. The resulting list of models is stored in models, which we then print using map() again to display summaries. The purrr package’s functions are a great choice for automating reusable tasks for their readability and efficiency.
04 Advanced Automation Techniques
After you are through with basic automation, more advanced techniques can be tried, such as: • • • Automating Model Selection: Utilize stepwise regression with help of step() function in order to automate the process of selection of the model based on characteristics like AIC. Parallel Processing: If it is difficult to handle large data or high computation models then one can utilize parallel or future packages necessary for the automation process. Reporting and Visualization: Perform regression analysis and automatically create reports and plots with the help of packages such as broom, ggplot2, rmarkdown. Here’s a quick example of automating model selection with the step() function: # Fit a full model with multiple predictors full_model <- lm(mpg ~ wt + hp + qsec + drat + cyl, data = mtcars) # Perform stepwise regression to select the best model best_model <- step(full_model) # Display the summary of the best model summary(best_model) The step() function conducts stepwise regression by adding or eliminating predictors on the basis of their contribution to the model, as measured by AIC.
05 Fast-Track Your Learning of OLS in R with Econometrics Assignment Help
The Econometrics Assignment Help service is specially developed for students to grasp the concepts of OLS regression and the R software quickly, making it perfect for anyone who wants to enhance their econometrics knowledge. How the Service Helps Students 1. Personalized Guidance: With our personalized support, then student can gain deep knowledge of various topics in econometrics and also real time feedback on their comprehension level. 2. Hands-On Learning: Our service extends a practical learning experience by offering step-by-step explanarion on solving exercises in R Studio. This practical way allow us to make sure that students do not only understand the theoretical part of the OLS regression, but learn how to apply them in Rstudio. 3. Expert Assistance: Our tutors are well-versed in econometrics and R, providing useful tricks and insights for a better learning experience. We provide detailed guidance on how to identify errors in r-codes and helpful tips to resolve them.
Tips and Tricks • • Start with Simple Models: Begin with simple linear regressions before moving to more complex models. Use R’s Help Documentation: Make use of R’s extensive help documentation for any functions you are unsure about. • Practice Regularly: Consistent practice is key to mastering both OLS regression and R.
05 Conclusion
Your productivity can be significantly increased by automating OLS regression analysis in R Studio, especially when working with big datasets or many models. Loops, functions, and packages like as purrr allow you to automate repetitive code development and free up time for result interpretation. By using these automation strategies, students can effectively complete their econometrics courses and assignments and obtain a deeper understanding of regression analysis without being hindered by the tedious manual coding tasks. It is wise to order the Econometrics Assignment Help service to those learners who want to master knowledge and get higher outcomes in the assignments.
Thank You www.tutorhelpdesk.com homework@tutorhelpdesk.com +1-6178070926