Individual points above or below 3 box heights are considered extreme outliers, and are marked with asterisks
Understanding the Published Faculty Salary Rate Boxplot Graph. Individual points above or below 3 box heights are considered extreme outliers, and are marked with asterisks

Individual points above or below 3 box heights are considered extreme outliers, and are marked with asterisks
E N D
Presentation Transcript
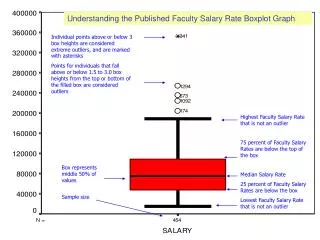
Understanding the Published Faculty Salary Rate Boxplot Graph Individual points above or below 3 box heights are considered extreme outliers, and are marked with asterisks Points for individuals that fall above or below 1.5 to 3.0 box heights from the top or bottom of the filled box are considered outliers Highest Faculty Salary Rate that is not an outlier 75 percent of Faculty Salary Rates are below the top of the box Median Salary Rate 25 percent of Faculty Salary Rates are below the box Lowest Faculty Salary Rate that is not an outlier Box represents middle 50% of values Sample size