Download
1 / 52
520 likes | 770 Views
So. California Prosperity. John Husing, Ph.D. Economics & Politics, Inc. Chief Economist, IEEP. After Losing 8.71 Million Jobs … Now At A Record Level of Jobs U.S. Jobs Long Slow Growth - Not Over-Heating. Now What?. Unemployment Rates: Full Employment. 18.0%.

E N D
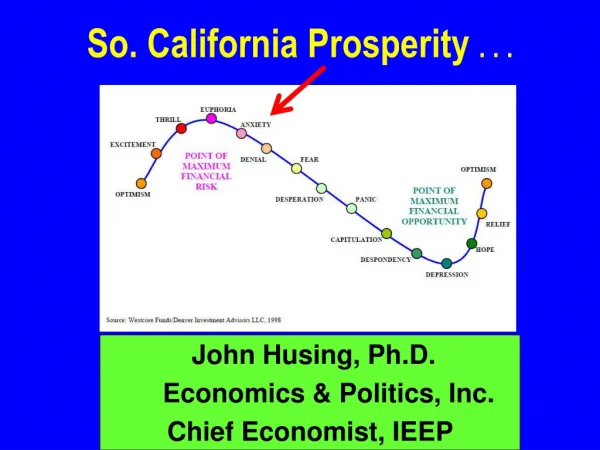
So. California Prosperity . . . John Husing, Ph.D. Economics & Politics, Inc. Chief Economist, IEEP
After Losing 8.71 Million Jobs … Now At A Record Level of JobsU.S. Jobs Long Slow Growth - Not Over-Heating Now What?
Unemployment Rates: Full Employment 18.0% 10.6% 9.1% 4.4%
Cut Taxes … Increase Spending • Lower Taxes • Massive Increase in Spending on Infrastructure • Result: Increased Deficit Spending Increased Upward Pressure on Employment • Increased Pressure On Prices FED Rate Increase Needed to Reduce Economic Pressure
California Job Gains/Losses Up 1,064,038 6.7% Up 2007 15,844,325 2016 16,908,363 Recovery 2,243,097 Great Recession -1,179,058
Gold Mine Theory Secondary Tier Primary Tier
Value of the Dollar:Helps Imports & Hurts Exports 100.0 2012-2016 25.6%
Port Container VolumesOn Pace To Tie 2nd Highest Import Level
Place Tariffs on Imports • Imports More Expensive • Lower Foreign Imports & Hurts the Inland Empire • Reduced U.S. Jobs Handling Imports • Improve U.S. Manufacturing Jobs except for Automation Losses • Higher Prices At Retail Stores
Corporate Taxes Based on U.S. Sales not Income • Retailer Buys U.S. Goods for $80 … Sell in U.S. For $100 … Pay Taxes on $20 • Retailer Buy Imports for $80 … Sell in U.S. For $100 … • Pay Tax on $100 • Mfg. Makes U.S. Goods for $80 … Sells Abroad for $100 … Pay $0 Taxes • Removes Incentive to Put HQ Abroad to Avoid U.S. Taxes • Discourages Imports & Hurts the Inland Empire • Encourages Exports • Could Bring Billions of Dollars Back to the U.S.
Net Industrial Space Absorption 19.4 Million Sq. Ft.
Industrial Vacancy Rate Low Everywhere! 2005/2006 2009Q3 2016Q3 San Diego 7.0% 12.0% 4.3% Inland Empire 2.7% 12.8% 4.3% Central Valley NA NA 2.0% Orange Co. 5.4% 6.5% 1.4% L.A. Co. 2.1% 3.2% 1.0% Source: CB Richard Ellis
Industrial Asking Price Per SF/Mo. Central Valley $0.36 Inland Empire $0.52 Ventura $0.65 Los Angeles$0.74 Orange $0.84 San Diego $0.85 Source: CB Richard Ellis
Logistics Powerful Job Growth • 2011-2016 • 10.7% of New Jobs • Median Pay $45,456
Manufacturing Jobs • 2011-2016 • 1.8% of Job Growth • Median Pay $52,000
Massive Infrastructure Spending Tariffs Affect Imports Potential For Higher Interest Rates Privatize Fannie Mae & Freddie Mac But Leave FHA Alone • Dollars For Freeways, Airports Transit, Harbors, Rail Lines • Greater Union Construction Job Growth • CA Opposition to Trump & CA Environmental Policies • Reduced Construction of Logistics Facilities • Lower Construction Job Growth • Fed Already Discussing More Rate Rises In 2017 Due to Hot Economy • Housing More Expensive • Dampen Home Sales & Residential Construction Jobs • All Mortgages Rates Act Like Jumbo Rates – Some Increase in Rates • Housing More Expensive • Still Have Lower Down Payments For Qualifying Homes • Dampen Home Sales & Residential Construction Jobs
Construction Jobs • 2011-2016 • 9.8% of Job Growth • Median Pay $52,000
Repeal & Replace Affordable Care Act • Repeal Without Replacement Could Unsettle Insurance Market • Impact of Repeal & Replace Together Depends Upon Conditions • Remove Penalty For Not Having Insurance • Previous Medical Conditions Use Subsidized High Risk Pool • Children Stay on Parents Insurance Until 26 • Eliminate Mandated Maternity & Mental Health Coverage • End Subsidies & Give Refundable Tax Credits For Coverage If No Employer Coverage • End Federal Subsidies for Medicaid, Use State Block Grants • Create Multi-State Insurance Markets
Potential Impact On Health Care Demand & Quality of Life 1,800,482 Drop in Uninsured -46.5% Drop in Share Uninsured
Health Care Jobs: Continuous Growth • 2011-2016 • 11.7% of Job Growth • Median Pay $60,000
High Paying Sectors Ahmad Adel Al-Khatib Jack Dangermond
Office Vacancy Rates Recovering But Remain High! 2006Q4 2009Q4 2016Q3 Inland Empire 7.6% 22.6% 13.8% Ventura NA NA 13.8% L.A. Co. 9.4% 14.1% 13.4% Central NA NA 11.9% San Diego 10.1% 18.0% 12.4% Orange Co. 7.3% 18.7% 9.7% Source: CB Richard Ellis
Office Asking Rate Per Sq. Ft./Month Central Valley $1.44 Inland Empire $1.85 Ventura $2.23 Orange $2.57 San Diego $2.78 Los Angeles $3.07 Source: CB Richard Ellis
Professionals & Mgmt., Higher Ed., Mining Utilities, Information Group Slowly Adding Jobs 2011-2016 8.9% of Growth Median Pay $75,000
Shrink Government Expand Military • Continued Decline in Non-Defense Government Jobs • Increase in Civilians & Military Defense Positions • Twenty-Nine Palms Marine Corps, San Bernardino Co. • Fort Irwin, San Bernardino Co. • March Air Reserve Base, Riverside Co. • Naval Surface Warfare Center, Corona; China Lake Naval Test Ctr. • Edwards Air Force Base, Kern County • Naval & Marine Corps Bases, San Diego • Naval Base, Oxnard • Air Force Missile Base, Los Angeles • Skunk Works, Boeing, Other Defense Contractors
Federal, State, Local Government 2011-2016 -0.3% of Job Growth Median Pay $62,000
Change In Corporate Tax Code • Hurt Retailers, Who Will Be Taxed on Domestic Sales Not Just Income • Reduced Retail Job Growth Already hurt by E-Commerce
Low Paying Job GrowthRetail, Consumer & Bus. Services, Hotel, Eat & DrinkAmusement, Agriculture, Employment Agency 2011-2016 44.6% of Job Growth Median Pay $30,000
Retail Vacancy Rate Inland Empire 8.9% San Diego 5.7% Los Angeles 4.6% Orange 4.0% Ventura 3.5% Source: CB Richard Ellis
Retail Asking Rate Per Sq. Ft./Month Inland Empire $1.95 San Diego $2.21 Orange $2.25 Ventura $2.30 Los Angeles $2.47 Source: CB Richard Ellis


