Download
1 / 21
210 likes | 528 Views
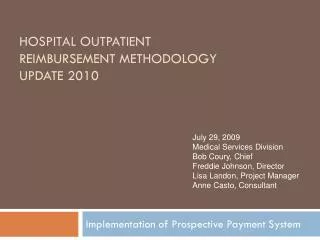
July 29, 2009 Medical Services Division Bob Coury, Chief Freddie Johnson, Director Lisa Landon, Project Manager Anne Casto, Consultant. Hospital Outpatient reimbursement methodology Update 2010. Implementation of Prospective Payment System. Meeting Objectives.

E N D
July 29, 2009 Medical Services Division Bob Coury, Chief Freddie Johnson, Director Lisa Landon, Project Manager Anne Casto, Consultant Hospital Outpatient reimbursement methodology Update 2010 Implementation of Prospective Payment System
Meeting Objectives • Provide overview of hospital outpatient reimbursement methodology change • Recommendation for 2010 • Differences between BWC and CMS application of OPPS • Changes to billing protocols • Impact of reimbursement methodology change
Hospital Outpatient Services • Hospital outpatient services • Clinic visits • Emergency Department • Ambulatory Surgery • Ancillary encounters • 2008 Stats • @ 236,000 encounters • Charges $292,760,038 • BWC reimbursement $142,958,161
Current Methodology • Current reimbursement methodology • Cost plus • Ohio Medicaid cost-to-charge ratio plus 16 percentage points, not to exceed 60% of allowed billed charges • Ohio BWC incurs a significant risk by using this type of reimbursement methodology • As charges increase so does BWC reimbursement levels • No limit on % increase of charges per year • There is some protection with the use of a cap (60% allowed billed charges)
Assessment – Current Status • Financial analysis • Under the current cost-based reimbursement system BWC is reimbursing at 49% of billed charges (146% cost) • 212% of Medicare
Medicare Payment Advisory Commission (MedPAC) • Report to Congress: Medicare Payment Policy (March 2009) • Chapter 2A (figure 2A-6) • Discusses private payer profits over the past 20 years • First period (1986 to 1992) • Payment to cost ratio grew from 1.20 to 1.31 • Second period (1993 to 1999) • Payment to cost ratio decreased from 1.31 to 1.15 • Third period (2000 to 2007) • Payment to cost ratio increased from 1.15 to 1.32 • In 2007, on average, private payers paid hospital more than 132% of their costs
Revised Methodology • Prospective reimbursement methodology • Encouraging providers to practice cost containment by establishing rates in advance of delivery • Hospital Outpatient Prospective Payment System • Utilized by Medicare for hospital outpatient services since August 1, 2000
Other States WC ProgramsUsing Medicare OPPS Model Median = 145% Mean = 148%
Revised Hospital Outpatient Methodology and Rates • Adopt a prospective payment methodology • Modified Medicare methodology • Effective date April 1, 2010 • Establish rates that meet Medical Services objectives • 166% CMS rate under Outpatient Prospective Payment System • Special consideration provided for Children’s Hospitals
Revised Hospital Outpatient Methodology and Rates • Challenges • Children’s Hospitals • 4 facilities • Children’s Hosp MedCtr, Cincinnati (6 visits) • Children’s Hosp MedCtr, Akron (239 visits) • Children’s Hospital, Columbus (22 visits) • Children’s Medical Center, Dayton (11 visits) • 2008 Statistics • 278 encounters (.11% total encounters) • Charges $392,956 (.13% total charges) • Reimbursement $235,773 (.16% total reimbursement)
Revised Hospital Outpatient Methodology and Rates • Challenges • Children’s Hospitals • Current methodology • 60% of billed charges (cap is hit) • 81% of cost • Under OPPS @166% Medicare • 39% of billed charges • 53% of cost • 253% of Medicare OPPS • 60% billed charges • 81% cost • Hold harmless Children’s Hospitals • Ensure continued access to quality care that meets a critical need
Differences in the Administration of OPPS • Hold harmless provision • Administered by CMS on a quarterly basis with reconciliation at year end • BWC will administer at the line item level • Capture the intent of the hold harmless provision by utilizing the payment to cost percentage from 1996 as designated by the provision and applying an add-on payment at the line item level • Inclusion of Workers Compensation specific services • Provide fee schedule reimbursement for services not included under OPPS • Vocational rehabilitation services • Items BWC covers that are excluded from Medicare benefit package
Differences in the Administration of OPPS • Integrated Outpatient Code Editor (IOCE) actions • Some IOCE action will be ignored or modified to meet the workers compensation environment • For example inpatient only denials • CMS denies the entire bill when inpatient only services are provided in the hospital outpatient setting (excluding critical care reported with CA modifier) • BWC will create a process for converting outpatient bills to an inpatient bill • Work with MCOs and Provider community to understand inpatient – only rules • Will monitor performance of inpatient – only procedures by facility; we expect performance to be rare and only under extenuating circumstances
Billing Protocol Changes • Modifier use • Allow facilities to report modifiers as outlined under official coding guidelines • Allowed revenue code revision • Align allowed revenue codes to mirror CMS where applicable • Continue to be revenue codes not applicable to the workers compensation setting • Modification to duplicate logic • Review rules surrounding two visits by different providers on same day
Hospital Outpatient Reimbursement - Summary • 166% OPPS rate • 253% OPPS rate Children’s Hospitals • On average reimbursement equals 114% of cost • Certain modifications to CMS OPPS components • Certain modifications to Integrated Outpatient Code Editor
Assessment • Data modeling and financial analysis provided by Cleverley + Associates • 2008 BWC data modeled under CMS 2009 OPPS regulations with customized modeling • Data clean up and BWC customized modeling was accomplished by Casto Consulting, Cleverley + Associates and BWC
Texas Hospital Association Study Inpatient (2006) • HMO/PPO 42%BC • WC (Texas) 35%BC • Medicare 25%BC Outpatient (2006) • HMO/PPO 39%BC • WC (Texas) 37%BC • Medicare 16%BC Texas Department of Insurance: Inpatient and Outpatient Fee Guideline 2008
Medicare Payment Advisory Commission (MedPAC) • Report to Congress: Medicare Payment Policy (March 2009) • Chapter 2A Assessing payment adequacy and updating payments in fee-for-service Medicare; Hospital inpatient and outpatient services • Average Medicare margin • 2007 was -5.9% • 2009 projected to be -6.9% • Interesting discussions • Hospitals under greater financial constraint are lower cost facilities as they are practicing cost constraint/containment • Non-profit hospitals with greater private payer margins are higher cost facilities; use margins to build, add staff, etc resulting in a higher per visit cost • Discuss at great length cost-shifting from Medicare/Medicaid to private payer
Milliman Study • Hospital & Physician Cost Shift: Payment Level Comparison of Medicare, Medicaid, and Commercial Payers (December 2008) • First study to quantify the cost shift • $88.8 billion cost shift (15% of payers amount spent on hospital and physician services) • 2006 Hospital Operating Margins • Medicare -9.4% • Medicaid -14.7% • Commercial 23.1% • Other gov’t & self pay -25.1%