GEO Integrated Data Environment
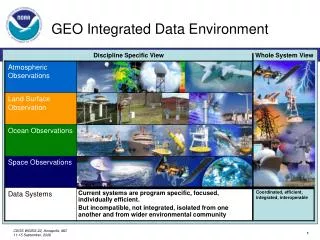
GEO Integrated Data Environment. Discipline Specific View. Whole System View. NOAA Plan for Integration GEO-IDE. Current systems are program specific, focused, individually efficient. But incompatible, not integrated, isolated from one another and from wider environmental community.

GEO Integrated Data Environment
E N D
Presentation Transcript
GEO Integrated Data Environment Discipline Specific View Whole System View NOAA Plan for Integration GEO-IDE Current systems are program specific, focused, individually efficient. But incompatible, not integrated, isolated from one another and from wider environmental community
http://www.nosc.noaa.gov/dmc/swg/swg_docs.html GEO-IDE Vision • “System of systems” – a framework to effectively and efficiently integrate NOAA’s many systems • Minimize impact on legacy systems • Utilize Standards • Work towards a service-oriented architecture using Web Services
NOMADS NOAA National Operational Model Archive and Distribution System • User growth phenomenal: • 5-7 Million downloads • 5-6 TB served per month • THREDDS Data Server • Unidata TDS Alpha testsite • Live Access Server • Cited as US-GEO and NOAA GEO-IDE pilot to advance • Partnerships: NASA ACCESS and OGC. GO-ESSP • New Java-based modular design being developed
Sea Ice Decline in the Arctic Update, August 2006 Sea ice extent continues to decline as the melt season progresses. While the ice has retreated poleward of its September average in most places, it is still outside of the September average off the western part of Alaska. The strongest ice retreats are along parts of the Russian coast. White = sea ice blue = open ocean gray = land masses pink line = average ice extent for September, the end of the summer melt season. The September average is calculated from 1979 through 2000.
Sea Ice Decline in the Arctic 1978 -2005 Trend 2005 2006 September minimum will be comparable to 2005 http://nsidc.org/news/press/2006_seaiceminimum/20060816_arcticseaicenews.html
NGDC Tsunami Inundation Gridding Project • Develop high-resolution (10 to 30 meter cell size) coastal DEMs for NOAA’s tsunami inundation modeling effort • More than 100 DEMs are planned for development • DEMs will also be useful for modeling hurricane storm surge and rainfall flooding Planned U.S. tsunami inundation DEMs Perspective view of Myrtle Beach, South Carolina 1/3 arc-second (10 meter) DEM
NGDC Tsunami Inundation Gridding Project • Identify and obtain best available digital data: e.g., multibeam sonar bathymetry, hydrographic surveys, SRTM topography, LiDAR topography and coastal bathymetry, high-resolution coastline, shoreline-crossing beach profiles, orthometric photos • Assess data quality using ESRI ArcGIS, satellite imagery, and NOAA nautical charts Data coverage for Myrtle Beach Adding of features not in digital datasets
NGDC Tsunami Inundation Gridding Project • Process data: Shift data to common vertical and horizontal datums (Mean High Water and WGS-84) • Generate and evaluate DEM: visual inspection for artifacts using slope maps and perspective views, and by comparison with known benchmark elevations Relationships between vertical datums Slope map highlighting grid areas with steep slopes
WGISS-22 NOAA Agency Report Thank You Questions?