Download
1 / 12
120 likes | 461 Views
Carbon Cycle Basics. Ranga Myneni Boston University rmyneni@bu.edu. Egon Schiele (1890-1918) Autumn Sun 1. 1/12. Carbon Pools. Carbon is stored on our planet in the following major pools: as organic molecules in living and dead organisms found in the biosphere;

E N D
Carbon Cycle Basics Ranga Myneni Boston University rmyneni@bu.edu Egon Schiele (1890-1918) Autumn Sun 1 1/12
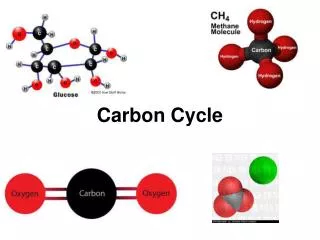
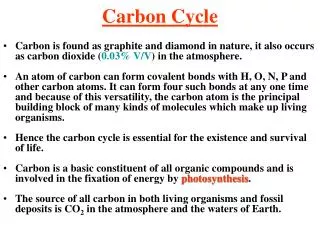
Carbon Pools • Carbon is stored on our planet in the following major pools: • as organic molecules in living and dead organisms found in the biosphere; • as the gas carbon dioxide in the atmosphere; • as organic matter in soils; • in the lithosphere as fossil fuels and sedimentary rock deposits such as limestone, dolomite and chalk; • in the oceans as dissolved atmospheric carbon dioxide and as calcium carbonate shells in marine organisms. 2/12
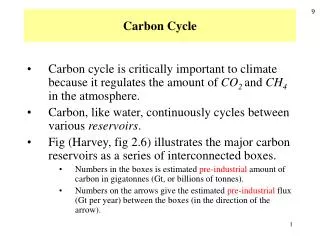
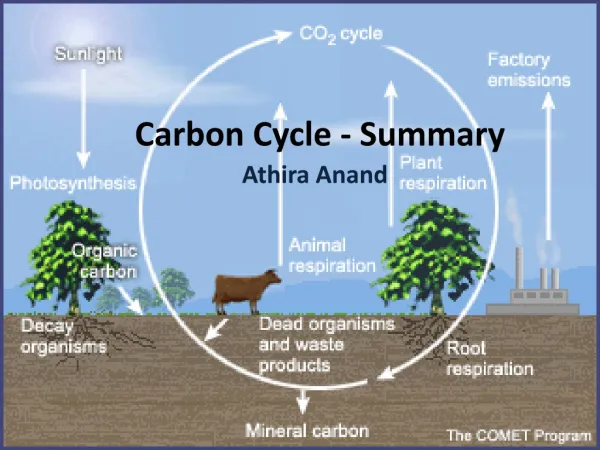
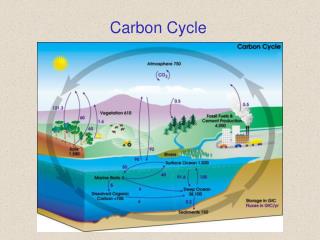
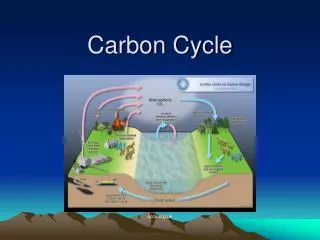
Global Carbon Cycle Carbon is exchanged between the active pools due to various processes – photosynthesis and respiration between the land and the atmosphere, and diffusion between the ocean and the atmosphere. 3/12
Atmospheric CO2 Concentration-1 Accurate and direct measurements of the concentration of CO2 in the atmosphere began in 1957 at the South Pole and in 1958 at Mauna Loa, Hawaii. 4/12
Atmospheric CO2 Concentration-2 In 1958, the concentration of CO2 was about 315 ppmv, and the growth rate was about 0.6 ppmv/yr. This growth rate has generally been increasing since then; it averaged 0.83 ppmv/yr in the 1960s, 1.28 ppmv/yr during the 1970s, and 1.53 ppmv/yr during the 1980s. The concentration in 2006 was over 380 ppmv. The annual cycle in the Mauna Loa record is due to the seasonality of vegetation. In early spring, the concentration of CO2 is at its maximum, and as the plants green-up, the concentration drops, reaching a minimum value towards the end of the summer, and when leaves fall, it starts to build up again. This swing in the amplitude is most pronounced in the records from the northern high latitudes, where it can be as large as 15 ppmv. 5/12
There are at least three arguments to be made for the case that the observed increase in atmospheric CO2 concentration is due to emissions related to human activity. The rise in atmospheric CO2 concentration closely follows the increase in emissions related to fossil fuel burning. (2) The inter-hemispheric gradient in atmospheric CO2 concentration is growing in parallel with CO2 emissions. That is, there is more land mass in the Northern hemisphere, and therefore more human activity, and thus, higher emissions, which is reflected in the CO2 growth in the Northern hemisphere (compared to the SH). (3) Fossil fuels and biospheric carbon are low in Carbon 13 (an isotope). The ratio of carbon 13 to carbon 12 in the atmosphere has been decreasing. Atmospheric CO2 Concentration-3 6/12
Historical Atmospheric CO2 Concentration This figures shows that the concentration of CO2 has never been grater than 300 ppmv for the past 400,000 years. 7/12
Terrestrial Carbon Processes-1 Schematic representation of the terrestrial carbon cycle. Arrows indicate fluxes; boxes indicate pools. The size of the boxes represents differences in carbon distribution in terrestrial ecosystems. CWD, coarse woody debris; Rh, heterotrophic respiration by soil organisms; PS, photosynthesis. Credits: Schulze et al. (2000), Managing forests after Kyoto, Science, 289:2058-2059. 8/12
Terrestrial Carbon Processes-2 Gross Primary Production (GPP): The amount that is fixed from the atmosphere, i.e., converted from CO2 to carbohydrates during photosynthesis, is called GPP, which is carbon assimilation by photosynthesis ignoring photorespiration. Terrestrial GPP has been estimated to be 120 Gt C/yr. Net Primary Production (NPP): Annual plant growth is the difference between photosynthesis and autotrophic respiration (Ra), and is referred to as net primary production (NPP). NPP is the fraction of GPP resulting in plant growth, and can be measured through sequential harvesting or by measuring plant biomass, provided turnover of all components (e.g., fine roots) is included. Global terrestrial NPP has been estimated to be 60 Gt C/yr, that is, about half of GPP is incorporated in new plant tissue. The other half is returned to the atmospheric as CO2 by autotrophic respiration, that is, respiration by plant tissues. 9/12
Terrestrial Carbon Processes-3 Net Ecosystem Production (NEP): is the difference between NPP and heterotrophic respiration (Rh), which determines the amount of carbon lost or gained by the ecosystem without disturbances, such as harvests and fire. NEP can be estimated from measurements of CO2 fluxes over patches of land. Global NEP is estimated at about 10 Gt C/yr. Net Biome Production (NBP): is the carbon accumulated by the terrestrial biosphere when carbon losses from non-respiratory processes are taken into account, including fires, harvests/removals, erosion and export of dissolved organic carbon by rivers to the oceans. NBP is a small fraction of the initial uptake of CO2 from the atmosphere and can be positive or negative; at equilibrium it would be zero. NBP is the critical parameter to consider for long-term (decadal) carbon storage. NBP is estimated to have averaged 0.2 +/- 0.7 Gt C/yr during the 1980s and 1.4 +/- 0.7 Gt C/yr during the 1990s. 10/12
Global Carbon Budget During the 1980s, carbon emissions totaled 5.4 +/- 0.3 Gt C/yr (Giga tons or 109 tons of carbon per year) from fossil-fuel burning and cement manufacture, and 1.7 (0.6 to 2.5) Gt C/yr from land-use changes. The net carbon flux into the oceans is estimated to be 1.9 +/- 0.5 Gt C/yr, and 0.2 +/- 0.7 Gt C/yr into the land. Because the atmospheric carbon increase is observed to be 3.3 +/- 0.1 Gt C/yr, there is still a 1.7 Gt C missing sink per year. For the 1990s, the estimates are somewhat similar, except for a larger land carbon sink. Many studies suggest 1 to 2 Gt of carbon sequestered in pools on land in temperate and boreal regions. 11/12
Spatial Pattern of Carbon Uptake This figure shows the zonal distribution of terrestrial and oceanic carbon fluxes. Results are shown for the 1980s (plain bars) and for 1990-1996 (hatched bars). Positive numbers are fluxes to the atmosphere. This figure represents our current understanding, that is, about 1 to 2 billion tons of carbon are somehow sequestered in sinks on land north of 30N. Elsewhere, the land is neutral, where sources nearly match sinks. The geographic distribution of the northerly land sink remains unknown. 12/12