Download
1 / 6
60 likes | 77 Views
Discover the no of tenders for Q1 and Q2 of 2022 month-wise<br>and The total no of #tenders, #bids and their values in crores by govt of #india.<br><br>Get the #statistics and analysis of The tenders released in financial year 2021-22 and 2022-23 And the no of #Business #opportunities in India

E N D
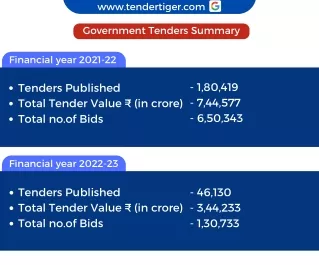
www.tendertiger.com Government Tenders Summary Financial year 2021-22 - 1,80,419 - 7,44,577 - 6,50,343 Tenders Published Total Tender Value ₹ (in crore) Total no.of Bids Financial year 2022-23 Tenders Published Total Tender Value ₹ (in crore) Total no.of Bids - 46,130 - 3,44,233 - 1,30,733
www.tendertiger.com No of Tenders in 2022 Month wise January 1,20,344 February 1,11,592 1,33,716 March 1,13,236 April May 1,28,987 June 1,22,626 0 50,000 100,000 150,000
www.tendertiger.com Tenders by top 6 States: financial year 2022-23 Uttar Pradesh 17.21% Others 28.41% Maharashtra 15.11% Madhya Pradesh 5.75% West Bengal 9.39% jammu and Kashmir 14.35% Rajasthan 9.58% State Total No.of Tenders Uttar Pradesh Maharashtra Jammu and Kashmir Rajasthan West Bengal Madhya Pradesh 52,600 46,175 43,850 29,290 28,696 17,584
www.tendertiger.com Tenders by top 5 Central Organizations: financial year 2022-23 Others 30.02% Military Engineer Services 40.82% Delhi development Authority 4.20% BSNL 6.19% Directorate of Purchase and stores 6.81% IHQ of MoD(Army) 11.96% Government Organization Total No.of Tenders Military Engineer Services IHQ of MoD(Army) Directorate of Purchase and Stores BSNL Delhi Development Authority 12,442 3,645 2,076 1,887 1,279
www.tendertiger.com Key takeaways: States Like Uttar Pradesh and Maharashtra with Large area or Huge Population and Population Density Releases High number of Tenders. India Spends 2.9% of its GDP on defense which is nearly 4.71lakh Crores. and thus it makes Sense that Military Engineer Services had highest number of tenders.
www.tendertiger.com is Your One Stop Solution for all Your tendering Needs Sign up Today to get Best Business Opportunities Contact us Sales@TenderTiger.com 9374519750 Find us on www.tendertiger.com Thank You