Download
1 / 14
140 likes | 186 Views
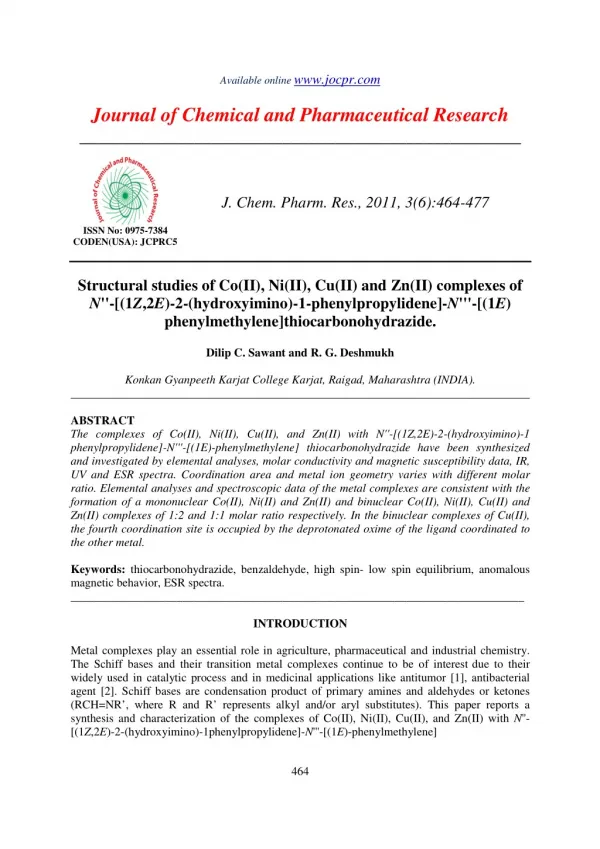
The complexes of Co(II), Ni(II), Cu(II), and Zn(II) with N''-[(1Z,2E)-2-(hydroxyimino)-1<br>phenylpropylidene]-N'''-[(1E)-phenylmethylene] thiocarbonohydrazide have been synthesized<br>and investigated by elemental analyses, molar conductivity and magnetic susceptibility data, IR,<br>UV and ESR spectra. Coordination area and metal ion geometry varies with different molar<br>ratio. Elemental analyses and spectroscopic data of the metal complexes are consistent with the<br>formation of a mononuclear Co(II), Ni(II) and Zn(II) and binuclear Co(II), Ni(II), Cu(II) and<br>Zn(II) complexes of 1:2 and 1:1 molar ratio respectively. In the binuclear complexes of Cu(II),<br>the fourth coordination site is occupied by the deprotonated oxime of the ligand coordinated to<br>the other metal. <br>

E N D
Available online www.jocpr.com Journal of Chemical and Pharmaceutical Research __________________________________________________ J. Chem. Pharm. Res., 2011, 3(6):464-477 ISSN No: 0975-7384 CODEN(USA): JCPRC5 Structural studies of Co(II), Ni(II), Cu(II) and Zn(II) complexes of N''-[(1Z,2E)-2-(hydroxyimino)-1-phenylpropylidene]-N'''-[(1E) phenylmethylene]thiocarbonohydrazide. Dilip C. Sawant and R. G. Deshmukh Konkan Gyanpeeth Karjat College Karjat, Raigad, Maharashtra (INDIA). ______________________________________________________________________________ ABSTRACT The complexes of Co(II), Ni(II), Cu(II), and Zn(II) with N''-[(1Z,2E)-2-(hydroxyimino)-1 phenylpropylidene]-N'''-[(1E)-phenylmethylene] thiocarbonohydrazide have been synthesized and investigated by elemental analyses, molar conductivity and magnetic susceptibility data, IR, UV and ESR spectra. Coordination area and metal ion geometry varies with different molar ratio. Elemental analyses and spectroscopic data of the metal complexes are consistent with the formation of a mononuclear Co(II), Ni(II) and Zn(II) and binuclear Co(II), Ni(II), Cu(II) and Zn(II) complexes of 1:2 and 1:1 molar ratio respectively. In the binuclear complexes of Cu(II), the fourth coordination site is occupied by the deprotonated oxime of the ligand coordinated to the other metal. Keywords: thiocarbonohydrazide, benzaldehyde, high spin- low spin equilibrium, anomalous magnetic behavior, ESR spectra. _____________________________________________________________________________ INTRODUCTION Metal complexes play an essential role in agriculture, pharmaceutical and industrial chemistry. The Schiff bases and their transition metal complexes continue to be of interestdue to their widely used in catalytic process and in medicinal applications like antitumor [1], antibacterial agent [2]. Schiff bases are condensation product of primary amines and aldehydes or ketones (RCH=NR’, where R and R’ represents alkyl and/or aryl substitutes). This paper reports a synthesis and characterization of the complexes of Co(II), Ni(II), Cu(II), and Zn(II) with N''- [(1Z,2E)-2-(hydroxyimino)-1phenylpropylidene]-N'''-[(1E)-phenylmethylene] 464
Dilip C. Sawant et al ______________________________________________________________________________ J. Chem. Pharm. Res., 2011, 3(6):464-477 thiocarbonohydrazide [3]. The reported schiff base is a condensation product of N”-[(1E,2Z- (hydroxyimino)-1-phenylpropylidene]thiocarbonohydrazide [4]and benzaldehyde, having nitrogen, oxygen, sulfur donor atoms promises interesting coordination chemistry [3]. Literature survey shows that the metal complexes compounds mentioned in this work are scantily reported with respect to their synthesis, characterization. EXPERIMENTAL SECTION Materials All chemicals and solvents used were of Analytical grade. All metal (II) salts were used as chlorides. Methods The elemental analyses were carried by standard methods [5]. The molar conductance measurements of the complexes in Dimethylformamide (DMF) were obtained using an Equiptronic EQ-660 conductivity meter. IR spectra were recorded on a FTIR -1615 of Perkin- Elmer spectrometer in KBr pellets. Magnetic susceptibility measurements were carried out by employing Gouy's balance using Hg[Co(SCN)4] as calibrant. The effective magnetic moments were calculated after diamagnetic correction for ligand component using Pascal's constants [6]. The uv-visible spectrum was recorded on Shimadzu UV-190 spectrophotometer brand. ESR spectra of copper complexes were recorded on a Varian E-line century series spectrometer equipped with a dual cavity and operating at the x-band (~9.4GHz) with 100 KHz modulation frequency. TCNE was used as field marker. Synthesis: Isonitrosopropiophenone was prepared by following the procedure of Hartung and Munch [7]. Thiocarbohydrazide was prepared by following procedure of L.F.Audieth, Earle S., Scott and Pery S. Kippur [8]. N’’-[(1E,2Z)-2-(hydroxyimino)-1-phenylpropylidene]thiocarbonohydrazide was prepared by following procedure [9]. Schiff base ligand N''-[(1Z,2E)-2-(hydroxyimino)-1- phenyl propylidene]-N'''-[(1E)-phenylmethylene]thiocarbonohydrazide following procedure [3]. Synthesis of metal complexes: We prepared the Co(II0, Ni(II0, Cu(II) and Zn(II) complexes of ligand N''-[(1Z,2E)-2- (hydroxyimino)-1-phenyl propylidene]-N'''-[(1E)-phenylmethylene]thiocarbonohydrazide (HL) with metal chloride in 1:2 molar (ML2) and equimolar ratio (ML). In the first case warm ethanol solution (70 ml) of HL (3.0 g, 0.0088M) was added to a stirred solution of metal chloride (0.0044M) in distilled water (75 ml). The mixture was refluxed in presence of 5M sodium hydroxide solution for 5h and cooled to room temperature. On cooling, precipitates were formed which were filtered, washed with ethanol and dried by suction. Crystallization from aqueous ethanol (50:50) gave the desired metal complex. In the second case use of equimolar ratio of HL and metal chloride and repeat the same. was prepared by 465
Dilip C. Sawant et al ______________________________________________________________________________ J. Chem. Pharm. Res., 2011, 3(6):464-477 RESULTS AND DISCUSSION The structure reported for the ligand N''-[(1Z,2E)-2-(hydroxyimino)-1-phenyl propylidene]-N'''- [(1E)-phenylmethylene]thiocarbonohydrazide (HL) [3] is as: CH3 OH N N NH N NH S N''-[(1Z,2E)-2-(hydroxyimino)-1-phenylpropylidene]-N'''-[(1E)-phenylmethylene]thiocarbonohydrazide Characterization of metal ion complexes of HPTBEN: The studied metal complexes of ligand were prepared in two ways: (1) by reacting 1:2 molar quantities of metal (II) chlorides and ligand in aqueous ethanol and (2) by reacting equimolar quantities of metal (II) chlorides and ligand in aqueous ethanol. Physical data The isolated compounds 1A, 1B and 1D have general composition M(L)2 where M is Co(II), Ni(II) and Zn(II). Another isolated compounds 1C, 2B, 2C and 2D have general composition [ML]2 where M is Cu (II), Ni(II) and Zn(II) and compound cobalt(II) complex 2A have general formula ML . Molecular weight determined by Rast’s Method with camphor as a solvent confirms the empirical formula. The compound 1A, 1B, 1C, 2A, 2B and 2C, have been found to be insoluble in dilute NaOH solution suggesting the absence of oximino proton (>C=NOH) or deprotonation of the O-H located at the oxime group. Another compound of Zinc(II) complexes 1D and 2D are soluble in dilute NaOH may suggest unaffected oximino group in complexation. All complexes are insoluble in water, dilute hydrochloric acid: partly soluble in Methanol, Ethanol, and Chloroform and highly soluble in DMF, DMSO. The complex is stable in air and stable at 200°C indicating high thermal stability and hence strong metal to ligand bond. The molar conductance values of the complexes in dimethyl formamide (0.30 to 18.285Ω-1cm3mol-1) are too low to account for the dissociation, therefore the complexes are considered to be non- electrolytes.In order to check the purity of the complex prepared the ligand HL and its soluble metal complexes were subjected to TLC studies. Magnetic susceptibility measurements and uv-visible spectra: The electronic spectra of all the complexes were recorded in chloroform. The wavelength of the absorption maxima are given in Table (II). A clear analogy is evident among the results for all compounds. In the spectra of free ligand π→π* transitions in the range, 30.77 to 42.55kk are not significantly altered on complex formation. The n →π* transitions associated with nitrogen of the azomethine and oxime group in free ligand are found in the range 29.85kk (∈=14737) and 25.64kk (∈=14042). In the complexes, the n→π* transition are shifted to higher energy. These results indicate that the nitrogen and/or oxygen atom of the oxime groups are coordinated to the metal ions. The 1A complex exhibits two bands at 17.39kk (ε=3733) and 21.32kk (ε=5221) in its 466
Dilip C. Sawant et al ______________________________________________________________________________ J. Chem. Pharm. Res., 2011, 3(6):464-477 electronic spectrum in DMF solution which are attributed to the 4T1g→4A2g (ν2) and 4T1g→ 4T1g(P) (ν3) transition, respectively, in an octahedral structure. The ligand field parameters are calculated to be 960cm-1 (B) and 9286cm-1 (10Dq). The calculated ν1 value (8104cm-1) as well as ν2/ν1 (2.14) are in agreement with the values reported for an octahedral structure [10]. The subnormal magnetic moment value (3.25BM) may be due to partial oxidation of the Co(II) to Co(III) in the presence of the ligand. The 2A complex shows magnetic moments 2.384BM, indicating that this complex has low spin, and square planar configuration. The square planar Co(II) complexes are reported to exhibit magnetic moments in the range 2.2 to 2.BM. The electronic spectra exhibit two bands in DMF at 18.5kk and 1562kk are assigned to 1A1g→2Eg and 2A1g→2B1g transition respectively. In view of the available reports on square planar Co(II) complexes [11-12]. The 1B complex is found to be only feebly paramagnetic (µ= 0.958 BM at 298K) suggestive a planar environment of ligands around Ni(II) ion [13]. The present nickel(II) complex shows two bands at 28.74kk (∈=~6624) and 20.41kk (∈=~1786) assigned to 1A1g→1B1g and 1A1g→1A2g transition respectively [10-14]. The fact that no band is observed below 10.00kk indicates square planer structure for this complex [10]that may be also be deduced from their brown colour.The other d-d bands possibly remain hidden by the intense π →π* transitions. The 2B complex is found to be 1.36BM which are normally expected for octahedral Ni(II) complex. In the electronic spectra bands observed at 20.77kk (ν2) and 27.53kk (ν1) are attributed to 3A2g(F) →3t1g(P) transition respectively. The spectral data are utilized to complete important ligand field parameters using ligand field theory of spin allowed transition in d8 configuration [15-16]. The value of 10Dq and B are utilized to calculate ν2 and ν3. The electronic spectral data together with reported magnetic moment values suggest an octahedral geometry for 2B complex [16]. The value of magnetic moment of 1C and 2C of copper complexes are found 1.23 and 0.86 respectively at room temperature consistent with square planar geometry around the metal ions. The observed magnetic moment values are much lower than the values expected theoretically for magnetically dilute Co(II) system. The decrease, however, may be associated with the antiferromagnetic interaction between copper (II) ions in the solid state. The subnormal magnetic moments of the complex may suggest a binuclear structure even in the solid state. Generally, the low magnetic moment values of binuclear copper complexes are attributed to the anti-ferromagnetic moment interaction between two central metal ions and/or it may be explained on the basis of the existence of a polymeric structure including copper-copper interaction or due to the covalent nature of metal-sulfur bond. The electronic spectra of theses complexes 1C and 2C, show band at 40.00kk and 28.6kk assigned to π→π* and n→π* transition respectively. Another band shown at 17.5kk assign to 2T2g→2Eg transition. The band positions are in agreement with those generally observed for square planar Cu(II) complexes. The complexes 1D and 2D of Zn(II), are diamagnetic, therefore the tetrahedral arrangement of the ligand molecules around Zn(II) is assigned to these complex. The electronic spectra of complex 2D show absorption band at 34.01kk due to the π→π* transition. This band is found to be shifted as compared to the position of the π→π* transition band in methanol solution of free ligand. This indicates that the π electron system of the ligand suffers considerable alteration on complex formation. Another bands observed is 28.90kk, 27.55kk and 26.18kk may be due to charge transfer transition. 467
Dilip C. Sawant et al ______________________________________________________________________________ J. Chem. Pharm. Res., 2011, 3(6):464-477 The ESR Spectra The ESR spectra of copper complexes provide information of importance in studying the metal ion environment. The X-band ESR spectra of 1C and 2C Copper complexes recorded in solid state. From the observed ‘g’ values of these at room temperature are: Table (I): ESR Data Copper complexes 1C g 2.1411 g⊥ 2.2215 gav 2.1947 A 190 1/A 0.0052 A⊥ G 0.637 F 112.6 α 0.8946 α2 0.8004 α 0.5196 α2 0.27 β 0.667 β2 0.445 The presence of two ‘g’ values (g, g⊥) compelled by Piesach and Blumberg’s method [16] suggests a planar geometry for the Cu(II) ion. All the ESR spectra shows a high field transition around 3000G (∆Ms=1) with the parallel, perpendicular and average ‘g’ values. The absence of ∆Ms=±2 half field transition around 1500G rules out the possibility of any Copper-Copper interactions in the complexes. The complex 2C show g>g⊥>2, and the complex 1C show g⊥>g>2. The g-tensor values of Cu(II) complex can be used to derive the ground state. In square planar complexes the unpaired electron lie in the dx2-y2 orbitalgiving 2B1g as the ground state with g>g⊥, while the unpaired electron lie in the dZ2 orbital giving 2A1g as the ground state with g>g⊥. From the observed values it is clear that the 2C shows g>g⊥, which indicates that the structure of the complex is square planar and that the unpaired electron is predominantly in the dx2-y2 orbital and the observed values of 1C shows g<g⊥, which indicates that the structure of the complex is square planar and that the unpaired electron is predominantly in the dZ2 orbital. The gvalues of these complexes are found to g<2.3 which indicates considerable covalent character of the metal-ligand bond. The values of g⊥<2.1 and g<2.3 may suggested the mixed Cu-N and Cu-O bonding in these complexes. The observed g values of 2C may suggest mixed Cu-N and Cu-O bonding in these complexes and the observed values of 1C, g⊥>2.1 may suggested presence of Cu-S bond [17]. In order to discuss the nature of the copper-ligand bond bonding in terms of these experimental parameters, the axial symmetry parameter G is less than four (G<4) indicate significant exchange coupling is present and the misaligned is appreciable and the ligand forming the Cu(II) complex is regarded as a strong field ligand. If G is greater than four (G>4), the local tetragonal axes are aligned parallel or only slightly misaligned or suggesting that although exchange interaction is present it is probably very small and hardly Parameters 2C 2.1990 2.0565 2.104 140 0.00714 70 3.522 157 0.8054 0.6487 0.6572 0.432 0.88 0.775 - 468
Dilip C. Sawant et al ______________________________________________________________________________ J. Chem. Pharm. Res., 2011, 3(6):464-477 influence the g-values [18-19]. The observed G value of complex 1C (G=0.637) indicate absence of Cu-Cu interaction in the complex and G value of 2C (G=3.552) indicates negligible exchange interaction of Cu-Cu in the complex. A perusal of ESR data deserves discussion on A and g parameters. The empirical factor f = g/ Acm-1 an index tetragonal distortion varies from 105 to 135cm for small to extreme distortion in square planar complexes [20]. The value of ‘ f ’ for 1C is 112cm and 2C is 157cm indicate small to extreme distortion in square planar complexes which depends on the nature of coordination atom. Molecular orbital coefficient, α2 (covalent in- plane, σ-bonding) and β2 (covalent in-plane, π-bonding) were calculated by using the following equation: α2 = -( A / 0.036 ) + ( g - 2.0023 ) + 3/7 ( g⊥ - 2.0023 ) + 0.04 β2 = ( g - 2.0023 ) E / -8 λα2 The α2 value account for a fraction of the unpaired electron density on the Cu(II) ion, the smaller value of α2, the higher the covalent bonding. The β2 value is regarded as in-plane π- bonding parameters. If the α2 value = 0.5, it indicates a complete covalent bonding, while the value of α2 = 10 suggests a complete ionic bonding. The observed value of 2C is 0.64, which indicate the moderately to more covalent nature of these complexes and 1C is 0.80 which indicates the complex have some covalent character and in plane σ-bonding is more covalent than in plane π-bonding. The value of β2 is in the range of 0.44 to 0.77, indicating no back donation is present in these complexes. According to Ushio Sakaguchi et al [17]correlation betweeng and A explains the bonding of donor atoms like N, O, S with Cu(II) ions. Increasing the positive charge on a donor atom set can be reduce A and increase ‘g’ values. The author [17] well define the correlation of g and A for Cu(II) centre with tetrahedral and tetragonal for CuS4, CuN4, CuO4, CuN2O2, CuN2S2. According to author [17], there is no complexes known square planar structure for which A is less than 0.014cm-1. The values of g and A of 2C are very close to CuN2O2 and 1C are very close to CuN2S2 region, at a point associated with considerable tetrahedral distortion. The A parameters of CuN2S2 system studies in the range of 140-173G suggested square planar CuN2S2 complex, confirmed by the g/A ratio in the complex is the range of 130cm. The infrared spectrum in KBr exhibits: The characteristic IR bands 400-4500cm-1 for the free ligand from those of its complex provide significant indications regarding the bonding sites of the ligand. A common feature of the infrared spectra of 1A, 1B, 2A, 2B, 1C and 2C complex in KBr discs is the absence of any absorption bands attributable to the various O-H vibrations like νO-H, in plane and out of plane δO-H seen at 3225, 1265 and 897cm-1 respectively in the spectrum of HPTBEN. This observation is amply supported by the fact that the complex is insoluble in the dilute alkali solutions indicating an absence of free oxime function in them. A band shown at 3213 and 3218, 1267 and 1267, 880 and 890 cm-1 in 1D and 2D Zn(II) complex respectively attributed to the various O-H vibrations like νO-H, in plane and out of plane δO-H seen at 3225, 1265 and 897cm-1 respectively in the spectrum of HPTBEN, may suggested presence of unaffected oxime group supported by solubility in dilute NaOH solution. An medium intense band between 3259 to 3435cm-1, may be due to presence of secondary amines N-H vibrations. Apart from these 469
Dilip C. Sawant et al ______________________________________________________________________________ J. Chem. Pharm. Res., 2011, 3(6):464-477 band, the complex show a weak intensity band around 1311cm-1 to 1332cm-1 which may be due to δN-H vibrations. On the loss of -NH proton in phenyl methylene hydrazide moiety in the complex, an additional νC=N absorption is found at higher energy than νC=N of the uncomplexed hydrazide. This new absorption band observed at 1645-1636cm-1 for 1A, 2A, 1B, 1C and 2C complex which is not shown in spectra of free ligand may be attributed to C=N vibration formed due to complexation of sulfur to the central metal ion, supported by shifting of absorption band observed due to νC=S and free δC=S. These two modes occurs at 1287 and 767cm-1 in the spectrum of free ligand respectively and it is lowered to 1110 to 1135 and 767cm-1 respectively in the spectra of 1A, 2A, 1C, 2C, 1D and 2D the shifting of these bands to indicative of coordination of thiolate sulfur to central metal ion.[21]. In spectra of 1B and 2B complex no new absorption band observed in range for C=N vibration due to complexation of sulfur to central metal ion, indicative of non coordination of thiolate sulfur to central metal ion. The absorption bands observed in between 1591 to 1628cm-1 are tentatively proposed to be due to azomethine and 1445 to 1447cm-1 tentatively proposed to be due to oximino C=N stretching vibration respectively. The downfield shift of azomethine an oximino bands in all spectra suggested that the azomethine nitrogen and oximino nitrogen and/or oxygen coordination to the central metal ion [22]. One more band observed in this region at 1520cm-1 due to HC=N of imino nitrogen in free ligand observed in shape of shoulder and merged with an medium intense band at 1491 to 1497cm-1 may be due to N-C=S, may be suggested non involvement in complexationexcept in complex 2A this band was shifted towards lower frequency may suggested this imines nitrogen coordinate with central metal ion. An oxime function is known to coordinate to the metal ion either through nitrogen or oxygen atom. In the spectra an medium intensity band observed at 1009 to 1017cm-1 attributed to the formation of N-O linkage and a medium intensity band observed at 1180cm-1 is also assigned perhaps erroneously to the N-O stretching vibrations [23]. The shift of N-O band may be indicate the metal complexes with the ligand, in which an oxime group coordinate through oximino oxygen to the central metal ion [23]. The newly formed medium intensity band at 1200 to 1350cm-1 in 1A, 2A, and 1B complex respectively, due to N → O linkage may be suggested an oxime group coordinates through its nitrogen atom. The presence of the N-O and N → O linkage in complex may be indicate M-N3O type of chromophore with an unsymmetrical five and six member ring structure becomes probable when these two bands observed, may suggested the bonding through both the nitrogen as well as oxygen atoms of the oxime function [23-24]. An absorption band due to νOH of water molecule shown in spectra of 2A, 2B and 2D at 3200 to 3600cm-1 may suggested the OH in structure. In other complexes no band observed in range of 1200 to 1350cm-1 due to N → O linkage may be suggested an oxime group coordinates through its oxygen atom only. The presence of the N-O linkage in complex may be indicates M-N2O2 type of chromophore with a symmetrical six member ring structure. Another set of medium intensity band at 690-696cm-1 may be due to out of plane C=C bending vibration of aromatic ring, supported a weak band a 3054 to 3073cm-1 due to C-H stretching. Another weak absorption at 2922 to 2987cm-1 may be due to C-H stretching vibration of free methyl group. The proposed five and six member ring structure would require the appearance of M-N, M-O and M-S vibration, have been reported to occur over a wide range 200 to 650cm-1. 470
Dilip C. Sawant et al ______________________________________________________________________________ J. Chem. Pharm. Res., 2011, 3(6):464-477 Table (II): Analytical and physical data of the ligand and its metal complexes Elemental Analysis % C Found (Calcd) (Calcd) 61.36 (60.10) (4.15) 49.64 (49.23) (4.10) 55.88 (55.45) (4.35) 48.03 (47.10) (4.62) 55.80 (55.47) (4.35) 51.25 (50.88) (3.74) 51.46 (50.88) (3.74) 49.05 (48.47) (4.04) 55.48 (54.97) (4.31) Magnetic Moments µ µ µ µ B.M. Electrical Conductance 10-3 M(in DMF) mhos Melting/ Dec. point ºC Yield % Moisture by KF % M Found (Calcd) % H Found % N Found (Calcd) 21.00 (20.62) 17.55 (16.89) 19.66 (19.03) 17.05 (16.16) 20.14 (19.03) 17.89 (17.46) 18.41 (17.46) 17.64 (16.63) 19.35 (18.86) % S Found (Calcd) 10.26 (9.43) 8.62 (7.72) 9.54 (8.70) 8.47 (7.39) 9.56 (8.70) 9.20 (7.98) 8.56 (7.98) 8.74 (7.60) 9.25 (8.62) dcs/ Compound Colour 4.30 L HPTBEN Yellow 58.00 - 245-246 - diamagnetic 0.586 Dark brown 14.35 (14.22) 8.72 (8.01) 16.84 (13.55) 8.38 (7.98) 19.1 (15.85) 19.0 (15.85) 16.99 (15.54) 8.36 (8.88) 4.36 2A Co(PTBEN) 99.0 2.99 >250 2.384 3.028 4.44 1A Co(PTBEN)2 Dark red 53.08 Nil >250 3.25 18.28 Coffee red 4.56 2B [Ni(PTBEN)(H20)2]2 96.22 5.10 >250 1.359 2.07 4.66 1B Ni(PTBEN)2 Brown 54.88 4.74 >250 0.958 4.94 4.10 2C [Cu(PTBEN)]2 brown 88.69 1.77 240 0.865 2.39 Red- Brown 4.25 1C [Cu(PTBEN)]2 39.50 Nil 208 0.89 12.60 4.55 2D [Zn(PTBEN)(OH)]2 Brown 95.76 7.01 249 diamagnetic 0.091 4.81 1D Zn(PTBEN)2 Yellow 26.91 1.74 225 diamagnetic 3.82 471
Dilip C. Sawant et al ______________________________________________________________________________ J. Chem. Pharm. Res., 2011, 3(6):464-477 Table (III): IR data of the ligand and its metal complexes ν ν ν νC=N cm-1 new M-S-C=N hine ν ν ν νC=N cm-1 azomet δ δ δ δN-H ν ν ν νN-N cm-1 ν ν ν νN–H cm-1 ν ν ν νC-H Ar cm-1 ν ν ν νC=N cm-1 imino ν ν ν νC=N cm-1 oximino ν ν ν νN → cm-1 new → → →O ν ν ν ν O–H cm-1oximino ν ν ν νC=S with ν ν ν νC=C cm-1 ν ν ν νN -O cm-1 code Compound N-C=S 1180 ν ν ν νN =O 1562 945 - 933 07 HPTBEN 3226 3260 3000 - 1602 1521 1442 1491 1286 1006 - 2A Co(PTBEN) - 3429 3067 - 1596 - 1445 1491 1306 1017 764 - 767 1287 767 1290 767 1273 767 1299 766 1287 769 1A Co(PTBEN)2 - 3387 3066 1645 1591 - 1447 1491 1311 - - 3643 (water) - - 2B [Ni(PTBEN)(H2O)2]2 3406 3048 - 1558 1518 1446 1492 - 1010 1574 - 1576 927 1585 - 1585 - 1587 - 1B Ni(PTBEN)2 - 3410 3052 1637 1600 - 1446 1496 - 1011 1015 1009 1009 2C Cu(PTBEN) - 3432 3067 1632 1606 - 1445 1497 - 1C Cu(PTBEN) - 3435 3073 1636 1609 - 1445 1497 - 2D Zn(PTBEN) 3218 3263 - - 1609 1521 1446 1492 - 1D Zn(PTBEN)2 3213 3259 3077 - 1628 - 1445 1491 1286 - 1009 472
Dilip C. Sawant et al ______________________________________________________________________________ J. Chem. Pharm. Res., 2011, 3(6):464-477 The structure reported for the complexes are: CH3 O N H3 C O N N Co NH N S S H N NH N NH N 1A: Co(PTBEN)2 CH3 N O NH N S N NH Ni N NH S N NH O N CH3 1B: Ni(PTBEN)2 H3 C N N N NH N Cu S O O N S Cu N NH N CH3 N 1C: [Cu(PTBEN)]2 473
Dilip C. Sawant et al ______________________________________________________________________________ J. Chem. Pharm. Res., 2011, 3(6):464-477 N H N N H3 C N O H S N Z n N S H O N C H3 N N H N 1D: Zn(PTBEN)2 H3 C O N O H2 C o N S N N H N 2A: Co(PTBEN) S NH NH N N H3 C Ni N H2O H2O O O OH2 OH2 N Ni CH3 N N NH H N S 2B: [Ni(PTBEN)(H20)2]2 474
Dilip C. Sawant et al ______________________________________________________________________________ J. Chem. Pharm. Res., 2011, 3(6):464-477 CH3 N N N Cu O N NH S S NH N O Cu N N N H3 C 2C: [Cu(PTBEN)]2 N NH H3 C N N S OH N Zn OH H O Zn N S H O CH3 N N NH N 2D: [Zn(PTBEN)(OH)]2 CONCLUSION From the present investigation it has been observed that there is a possibility of formation of a new ligand N''-[(1Z,2E)-2-(hydroxyimino)-1-phenyl phenylmethylene]thiocarbonohydrazide and its complexation with metal ions like Co(II), Ni(II), propylidene]-N'''-[(1E)- 475
Dilip C. Sawant et al ______________________________________________________________________________ J. Chem. Pharm. Res., 2011, 3(6):464-477 Cu(II) and Zn(II). The data explain its geometrical symmetries i.e. octahedral bridge square planer and tetrahedral respectively. Acknowledgement The authors wish to acknowledge the encouragement given by the, H.R.Bandodkar Managing Director Hindustan Monomers Pvt ltd Dombivli. They are also thankful to the Head chemistry department, IIT Mumbai; for the pmr and esr spectral measurements, and The Director, The Institute of science Fort Mumbai, for magnetic measurements. For graciously making available facilities conductive to my work, I sincerely thank Konkan Gyanpeth Karjat College Chairman, other committee members of and heartily thank the teaching and non teaching staff of the chemistry department for encouraging my work. REFERENCES [1]A.J. Crowe, in "Metal Based Antitumor Drugs", M. Gielen (Ed), Vol 1, Freund, London, 1988 [2]M.J. Seven and L. A. Johnson, "Metal Binding in Medicine", Lippincott Co, Philadelphia, PA, 4ta Ed, 1960 [3]Dilip C Sawant, A.Venkatchallam, R.G.Deshmukh, E-Journal of Chemistry, 2010, 7(2), 409- 418. [4]R.G.Deshmukh – M.Sc Thesis. (by Research), 1983. [5]G.H.Jeffery, J.Bassett , Longman publication, Vogel’s Textbook of Quantitative chemical analysis, 5th edition, 1996. [6]R.L.Dutta, A.Syamal, Elements of Magnetochemistry; S.Chand and Company Ltd. Ramnagar, New Delhi, 1982. [7]W.Hartung and J.C.Munch, J.Am.Chem.Soc, 1929, 51, 2264. [8]L.F.Audrieth, Earle S.Scott and Perry S.Kippur, CA, 10857e, 1955. [9]D C Sawant, M.Sc. Thesis, Univ. of Mumbai, April 2006. [10]Lever, A. B. P., Inorganic Electronic Spectroscopy (second edition), Amsterdam, Elsevier 1984. [11]Patil R B, J Indian Chem Soc,1981, 58, 944; and 1983, 60, 79. [12]Atre V, Reddy G V, Sharada L N & Ganorker M C, Indian J. Chem,1982, 21A, 935. [13]Rajib Lal De, Mahuya mandal, Lovely Roy & Jaydeep Mukherjee, Indian J. of Chem, Feb 2008, 47A, 207-213. [14]G.M.Abdu El-Reash, F.I.Taha and G.E.Badr, Bull.Soc.Chim.Fr.,1990, 127, 387. [15]Konig E, The nephelauxetic effect- structure and bonding (Springer, New York) 1971. [16]Cotton F A & Wilkinson G, Advanced inorganic chemistry (Wiley Intersciences, New York) 1988. [17]Peisach J and Blumberg w E, EPR of metal complexes, edited by The Fu Yeh (adam Higler Ltd.London) 1969; 71 [18]Jairama and d’Souza M V, Indian J.Chem.,1986, 25A, 183. [19]Griffith J S, The Theory of Transition Metal ions, Cambridhge University press, 1961. [20]Ushio sakaguchi and Anthony W Addision, J.Chem.Soc. (Dalton), 1979, 600. [21]R N Patel, Indian J. of Chem, 2009, 48A, 1370-1377. [22]K.S. Abou-Melha and H. Faruk J. Iran. Chem. Soc., March 2008, 5 (1), 122-134. [23]C Lodeiro, R Basitida et al; Transition Met Chem, 2003, 28, 388. 476
Dilip C. Sawant et al ______________________________________________________________________________ J. Chem. Pharm. Res., 2011, 3(6):464-477 R.G.Deshmukh – Ph.D Thesis. Univ. of Bombay, 1992. 477