Download
1 / 10
100 likes | 200 Views
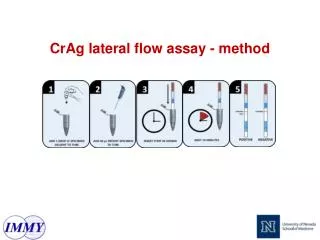
A simple reverse phase HPLC method was developed for the determination of the<br>phenoxymethylpenicillin in pharmaceutical dosage. Efficient chromatographic separation was<br>achieved on Lichrospher 100 RP-18e, 250 x 4.0mm 10µ column from waters-2998 isocratic ode,<br>with simple mobile phase combination of phosphate buffer : methanol : water (8:42:50). Adjust<br>pH of the mixture to 3.5 ± 0.05 with ortho phosphoric acid used. The flow rate was 1.2ml/ min<br>and effluent was monitored at 254 nm. The retention time of phenoxymethyl penicillin was<br>16.529 minutes. The proposed method is simple, selective, reproducible, sensitive and accurate<br>with good precision. Some of the methods were proved to be superior to most of the reported<br>methods. All these proposed methods for estimation of selected drug phenoxymethylpenicillin<br>was successfully applied in pharmaceutical formulations.

E N D
Available on line www.jocpr.com Journal of Chemical and Pharmaceutical Research __________________________________________________ J. Chem. Pharm. Res., 2010, 2(4):415-424 ISSN No: 0975-7384 CODEN(USA): JCPRC5 Assay Method Validation Of 4-Hydroxy Phenoxymethylpenicillin And Phenoxy Methyl Penicillin In Phenoxymethylpenicillin Tablets By RP-HPLC *Pratheep Kumar Chitithoti1, Udaya Bhaskar Rao.A2, Srikanth.I2, Varlaxmi Sailaja.S2, Kishore.K2,Jagadesh.K3, Shiva Krishna.N3 1Department of Pharmaceutical Analysis, Prist University, Thanjavur, Tamil Nadu. 2Department of pharmaceutical Analysis, Andhra University, Vizag-530001 3Department of Pharmacy, Dr. Samuel George Institute of Pharmaceutical Sciences, Markapur, Prakasam, India. ______________________________________________________________________________ ABSTRACT A simple reverse phase HPLC method was developed for the determination of the phenoxymethylpenicillin in pharmaceutical dosage. Efficient chromatographic separation was achieved on Lichrospher 100 RP-18e, 250 x 4.0mm 10µ column from waters-2998 isocratic ode, with simple mobile phase combination of phosphate buffer : methanol : water (8:42:50). Adjust pH of the mixture to 3.5 ± 0.05 with ortho phosphoric acid used. The flow rate was 1.2ml/ min and effluent was monitored at 254 nm. The retention time of phenoxymethyl penicillin was 16.529 minutes. The proposed method is simple, selective, reproducible, sensitive and accurate with good precision. Some of the methods were proved to be superior to most of the reported methods. All these proposed methods for estimation of selected drug phenoxymethylpenicillin was successfully applied in pharmaceutical formulations. ______________________________________________________________________________ INTRODUCTION It is necessary to find the content of each drug either in pure or single, combined dosage forms for purity testing[1] It is also essential to know the concentration of the drug and it’s metabolites in biological fluids after taking the dosage form for treatment. The scope of developing and 415
Pratheep Kumar Chitithotiet al J. Chem. Pharm. Res., 2010, 2(4):415-424 _____________________________________________________________________________ validating analytical methods is to ensure a suitable method for a particular analyst more specific, accurate and precise. The main objective for that is to improve the conditions and parameters, which should be followed in the development and validation. Penicillin V is a broad-spectrum antibiotic that kills a wide variety of bacteria that cause a wide variety of commonly occurring infections. Penicillin V may be used to treat infections of the lungs and airways, mouth and throat, skin or soft tissue, or ears[2]. It may also be used to continue treatment for infections that have been treated initially with injections of benzyl penicillin. Penicillin V has in vitro activity against gram-positive and gram-negative aerobic and anaerobic bacteria. The bactericidal activity of Penicillin V results from the inhibition of cell wall synthesis and is mediated through Penicillin V binding to penicillin binding proteins (PBPs). Penicillin V is stable against hydrolysis by a variety of beta-lactamases, including penicillinases, and cephalosporinases and extended spectrum beta-lactamases [3]. Chemical Name : (2S,5R,6R)-3,3-dimethyl-7-oxo-6-[[2- (phenoxy)acetyl]amino]-4-thia-1- azabicyclo[3.2.0]heptane-2-carboxylic acid. A survey of literature reveals that HPLC method is not available for simultaneous estimation of the drugs like phenoxy methyl penicillin and 4 hydroxy phenoxy methyl penicillin in combined tablet dosage form Even though very few methods such as UV and HPTLC are available for estimation of above drugs either in single or combination with other drugs, many of them suffer from one disadvantage or the other, such as low sensitivity, lack of selectivity and simplicity etc. [4] EXPERIMENTAL SECTION Phenoxymethylpenicillin was obtained from Glen mark (Mumbai, India). Potassium dihydrogen phosphate was of HPLC grade and obtained from E.merck (Mumbai, India) and all other chemicals used were of analytical grade. Purified water from Milli-Q-system (Millipore, Bangalore, India) was used throughout the analysis. Chromatographic measurements were performed on an isocratic HPLC of waters-2998 with Lichrospher 100 RP-18e, 250 x 4.0mm column. Preparation of Standard Solution [5]: Weigh accurately about 55 mg of phenoxymethylpenicillin potassium working standard in to 50.0 ml volumetric flask add to it about 35 ml of diluents and sonicate to dissolve, dilute up to the mark with diluents and mix well. (Concentration of phenoxymethylpenicillin is about 992 µg/ml) 416
Pratheep Kumar Chitithotiet al J. Chem. Pharm. Res., 2010, 2(4):415-424 _____________________________________________________________________________ Preparation of Reference solution (a): Weigh accurately 4.0 mg of 4-hydroxyphenoxymethylpenicillin potassium in to 100.0 ml volumetric flask, add to it about 70 ml of diluents and sonicate to dissolve, dilute up to the mark with diluents and mix well. (Concentration of 4-hydroxyphenoxymethylpenicillin potassium is about 40µg/ml) Preparation of Reference Solution (b): Weigh accurately 1.0 mg of phenoxymethylpenicillin potassium and 1.0 mg of benzyl penicillin potassium into 5.0 ml volumetric flask, add to it about 3 ml of diluents and sonicate to dissolve[6] dilute up to the mark with diluents and mix well. (Concentration of phenoxymethylpenicillin potassium & benzyl penicillin potassium is about 200µg/ml respectively). Preparation of Test Solution: Weigh accurately not less than 20 tablets and determine the average weight. Crush the tablets to fine powder. Weigh accurately the powder equivalent to 50 mg of phenoxy methyl penicillin into a 50.0 ml volumetric flask add to it 30 ml of diluents and sonicate to dissolve for about 5 minutes. Dilute up to the mark with diluents and mix well. (Concentration of phenoxymethylpenicillin is about 1000µg/ml) Prepare the test solutions immediately before use [7]. Chromatographic conditions Column used Lichrospher 100 RP-18e, 250×4.0mm, 10µ, Flow rate 1.20ml/min, Detector UV Visible Detector, Wavelength 254 nm, Injection 20 µl ,Column oven Temperature Ambient Sample cooler Temperature 50 c , Run Time 30 minutes. Method development Working standard of various concentrations was prepared by taking aliquots of standard solution and diluted to get required concentration for calibration plot and which was injected [8,9]. Assay preparation for commercial formulation Twenty capsules were taken; average weight was determined and mixed well fine powder. Powder equivalent to 250mg of penicillin v was transferred into 100ml volumetric flask and dissolved in sufficient amount of diluents and sonicated to dissolve. Take 5ml of the aliquot in 50ml standard flask and make up the volume with 50ml with the diluents. Solution was filtered through 0.45µ membrane filter and then the filtrate was further diluted to get the required concentrations Procedure 20µl of the standard preparation and assay preparation were separately injected. Method Validation The objective of method validation is to demonstrate that the method is suitable for its intended purpose as it is stated in ICH guidelines [10-13]. The method was validated for linearity, precision (repeatability and intermediate precision), accuracy specificity, short-term stability and system suitability. Phenoxy methyl penicillin Standard plots were constructed with ten 417
Pratheep Kumar Chitithotiet al J. Chem. Pharm. Res., 2010, 2(4):415-424 _____________________________________________________________________________ concentrations in the range of 50-150 % (µg/ml) prepared in triplicates to test linearity. The ratio of peak area signal of each drug to that of IS was plotted against the corresponding concentration to obtain the calibration graph [14]. The linearity was evaluated by linear regression analysis that was calculated by the least square regression method. The precision of the assay was studied with respect to both repeatability and intermediate precision. Repeatability was calculated from six replicate injections of each freshly prepared standard solution in the same equipment at a concentration 50 mcg/mL of the intended test concentration value on the same day.[15] The experiment was repeated by assaying freshly prepared solution at the same concentration additionally on two consecutive days to determine intermediate precision. Peak area ratios of each standard to that of IS were determined and precision was reported as % R.S.D. Method accuracy was tested (% recovery and % R.S.D. of individual measurements) by analyzing samples of each drug at three different levels in pure solutions using three preparations for each level. [16] The results were expressed as the percentage of each drug recovered in the samples. Specificity was assessed by comparing the chromatograms obtained from sample of pharmaceutical preparation and standard solution with those obtained from excipients which take part in the commercial tablets and verifying the absence of interferences RESULTS AND DISCUSSION System Suitability: A Standard solution was prepared by using, phenoxymethylpenicillin working standards as per test method and was injected six times into the HPLC system. The system suitability parameters were evaluated from standard chromatograms by calculating the % RSD from six replicate injections for phenoxymethylpenicillin retention times and peak areas. All system suitability parameters meets the predetermined acceptance criteria’s as per the test method indicates suitability of the selected system . Table 1: Repeatability Injection number 1 1603817 2 1605640 3 1604464 4 1604426 5 1603631 6 1604134 7 1603507 8 1605524 9 1603452 10 1601310 Average 1603991 SD 1219.1 %RSD 0.1 Phenoxymethylpenicillin 4- hydroxyphenoxymethylpenicillin 34926 34864 34902 34864 34871 34829 34908 34926 34847 34830 34877 36.8 0.1 418
Pratheep Kumar Chitithotiet al J. Chem. Pharm. Res., 2010, 2(4):415-424 _____________________________________________________________________________ Precision Studies: Repeatability: Standard solution of phenoxymethylpenicillin working standard at 100% targeted concentration was prepared as per the proposed test procedure for repeatability studies. Ten replicate injections were injected into the HPLC system. %RSD for the peak responses as the peak area was calculated, results are shown in Table No.1 and 2 Table 2 Method Precision Method Precision: Six test preparations were prepared as per the proposed test method by weighing the uniform sample matrix for individual test preparation. All individual test preparations were injected into the HPLC system as per the test method. Table 3 Linearity Phenoxy methylpencellin 4-Hydroxy phenoxy methyl pencillin Mg/tab Total Sample number Mg/tab % % Mg/tab % Assay 99.9 99.5 99.7 99.6 99.7 99.8 99.7 0.1 0.1 Assay 2.1 2.0 2.1 2.0 2.0 2.0 2.03 0.1 2.5 Assay 102.0 101.5 101.8 101.6 101.7 101.8 101.73 0.2 0.2 1 2 3 4 5 6 249.69 248.75 249.26 248.94 249.33 249.41 249.23 0.3 0.1 5.20 5.10 5.20 5.06 5.05 5.05 5.11 0.1 1.4 254.89 253.85 254.46 254.0 254.38 254.46 254.34 0.4 0.1 Average SD % RSD Peak Area Response Concentration (µg/ml) 50% 60% 70% 80% 90% 100% 110% 120% 140% 150% Correlation coefficient Slope (m) Intercept (y) Statistical Y intercept phenoxymethylpenicillin 4-hydroxyphenoxymethylpenicillin 817731 16260 969460 19567 1124207 22463 1282818 25712 1444186 28881 1587668 31943 1760459 34905 1920452 38566 2236959 44696 2392500 48279 0.9999 0.9998 1592.4850 895.2565 21964.2944 272.1407 1.4 0.9 419
Pratheep Kumar Chitithotiet al J. Chem. Pharm. Res., 2010, 2(4):415-424 _____________________________________________________________________________ Linearity The linearity studies of detector response for phenoxymethylpenicillin were evaluated in the concentration range from about 50% to 150% of the targeted concentration. The diluted standard solutions were prepared from stock solution in the above range and analyzed using proposed analytical method by injecting each level in duplicate injections. The linearity graph of average area response verses concentration was plotted and the correlation coefficient was calculated. The correlation coefficient meets the acceptance criteria indicates that the peak responses are linear. This concludes that the method is linear throughout the range selected. Results are tabulated in table-3 Fig 1Phenoxymethylpenicillin Fig 2 4-Hydroxyphenoxymethylpenicillin Table-4 Accuracy Recovery level Mean peak area response of PMP 817704 1582339 2380278 mean% Recovery % RSD recovery Mean peak area response of 4 hydroxy PMP 15738 31716 47268 mean% Recovery % RSD recovery 50% 100% 150% 99.5 99.5 99.5 0.2 0.2 0.2 99.8 99.1 101.5 0.0 0.3 0.4 Accuracy: An accuracy study was conducted by spiking the known amount of phenoxymethylpenicillin in the equivalent weight of placebo. Accuracy study was conducted in triplicate at three different levels, (50%, 100%, and 150% of targeted concentration). The samples were analyzed as per the proposed test procedure and the % recovery for each spike level was calculated. The precision at 420
Pratheep Kumar Chitithotiet al J. Chem. Pharm. Res., 2010, 2(4):415-424 _____________________________________________________________________________ each spike level was also established. The results found within acceptance criteria, hence the method are accurate throughout the selected range. The results are tabulated in Table-4 Specificity: Placebo Interference: Placebo solution were prepared in triplicate by weighing the equivalent amount present in the finished drug product and analyzed as per proposed method. There was no interference from placebo at retention time of phenoxymethylpenicillin and 4-hydroxyphenoxymethylpenicillin peak. Hence the method is specific. Sample As Such: Test preparation was prepared as per the test method and injected into HPLC system and % assay of phenoxymethylpenicillin and 4-hydroxyphenoxy methyl penicillin was calculated. The peak purity result of the sample solution was evaluated. Purity angle of phenoxymethylpenicillin peak and 4-hydroxyphenoxy methyl penicillin in sample chromatogram was lesser than the purity threshold. As per waters, empower software it can be concluded that the peak purity of phenoxymethylpenicillin peak and 4-hydroxyphenoxymethylpenicillin was passed and method is specific. Fig 3 Robustness: Robustness of the proposed analytical method was evaluated by making deliberate changes in the chromatographic system method parameters i.e. flow rate and wave length), the standard solution and test solutions were injected for each of the changes made to access the robustness of proposed analytical method. The effect due to change in flow rate on the system suitability parameters are compared. The system suitability parameters found comply as per acceptance criteria, hence it is concluded that the analytical results remain unaffected even there is change in flow rate by ±10% and wave length by ±5 nm. . Forced Degradation Studies: The stress degradation study was carried out on the sample preparations (higher strength) of phenoxymethylpenicillin tablet, and the degradation was evaluated by calculating the % 421
Pratheep Kumar Chitithotiet al J. Chem. Pharm. Res., 2010, 2(4):415-424 _____________________________________________________________________________ degradation of 1.0 % -50 % was tried by the stress conditions like acid stress, alkaline ,peroxide, thermal and photolytic degradation to prove the stability indicating characteristics of the method. Purity angle of phenoxymethylpenicillin and 4-hydroxyphenoxymethylpenicillin peak in stressed sample chromatogram was lesser than the purity threshold. As per waters, empower software it can be concluded that the peak purity of 4-hydroxyphenoxymethylpenicillin and phenoxymethylpenicillin peak was passed and method is specific. From forced degradation studies, it is observed that the proposed acceptance criteria meet the requirements. The peak purity results of complete forced degradation studies for the sample solution are summarized in Table 5 & 6 and Fig No 4-8. Based on the forced degradation studies carried out proposed analytical method can be considered as stability indicating method and can be used for release and stability studies for effective evaluations. Table No 5 Forced degradation studies Stress condition % assay Phenoxymethylpenicillin 4-hydroxy PMP % assay % degradation NA % degradation As such (unstressed sample) Acid degradation Alkali degradation Peroxide degradation Thermal degradation 101.5 2.5 NA 85.8 66.7 66.7 15.5 34.3 34.3 1.8 1.6 1.8 28 36 28 100.2 1.3 2.1 16 Table No 6 Peak Purity Results phenoxymethylpenicillin Purity threshold flag 4.009 No Stress condition acid degradation Alkali degradation Peroxide degradation Thermal degradation Photolytic degradation 4-hydroxyphenoxymethylpenicillin Purity angle threshold 2.889 4.156 Purity angle 0.101 Purity remarks Purity Purity flag No remarks Passes Passes 0.072 0.252 No Passes 0.194 0.324 No Passes 0.111 2.030 No Passes 0.620 2.241 No Passes 0.090 0.258 No Passes 0.109 0.273 No Passes 0.099 0.099 No passes 0.085 0.264 No passes 422
Pratheep Kumar Chitithotiet al J. Chem. Pharm. Res., 2010, 2(4):415-424 _____________________________________________________________________________ Fig No 5 Fig No 4 Fig No 7 CHROMATOGRAMS OF FORCED DEGRADATION STUDIES Fig No 6 Fig No 8 Fig No 4-8: Acid degradation, Alkali degradation, Peroxide degradation, Thermal degradation, Photolytic degradation respectively 423
Pratheep Kumar Chitithotiet al J. Chem. Pharm. Res., 2010, 2(4):415-424 _____________________________________________________________________________ CONCLUSION Analysis of drugs present in combined pharmaceutical dosage forms is a quite challenging problem and hence attempts were made phenoxymethylpenicillin present in dosage forms. The proposed method is simple, selective, reproducible, sensitive and accurate with good precision. Some of the methods were proved to be superior to most of the reported methods. All these proposed methods for estimation of selected drug phenoxymethylpenicillin was successfully applied in pharmaceutical formulations. The proposed method can be used as alternative methods to the reported ones for the routine determination of selected drug under the study in pharmaceutical dosage forms. Thus the purpose of the present investigation was successfully achieved. Acknowledgement The authors are thankful to the Management, prist university, for providing necessary facilities to carryout this work. And we are greatful my parents to their encouragement and guidance. REFERENCES [1] Mendum J., Denny R.C., and Thomas, M.N., Vogel’s Text book of Quantitative Analysis, 6th Edn., Pearson education ltd., 2004. [2] Lindberg RL; Huupponen RK; Huovinen P. Antimicrob Agents Chemother, 1984, 26(3); 300–302. [3] Churilova NS. Antibiotic Medicinal Biotechnol, 1985, 30(2); 90-110 [4] Genowefa P; katarzyna M; Stefan T. Journal of chromatography A, 2005, 1087(1-2); 197-202 [5] Beckett A.H. and Stanlake J.B., Practical Pharmaceutical Chemistry, 4th Edn., Part 2, CBS Publishers and Distributors, 2002. [6] Corners’ K. A., Textbook of Pharmaceutical Analysis, 3rd Edn., A Wiley Interscience Publication, 1999. [7] B. Jayakar, M. Kumar*, C. Saravanan and M. V., J. Chem. Pharm. Res., 2010, 2(1): 478-48.. [8] Chatwal G.R. and Anand S.K., Instrumental Methods of Chemical Analysis, Himalaya Publishing House, 2004. [9] USP 28, NF 23, The United State Pharmacopeial Convention, Asian Edition, 2005. [10] USP 28, NF-23, The United State Pharmacopoeial Convention Asian Edition 2008. [11] Indian pharmacopoeia, volume-II, the controller of publication, Delhi, 1996, 583. [12] Genowefa P; katarzyna M; Stefan T. Journal of chromatography A, 2005, 1087(1-2); 197- 202 [13] The United States Pharmacopoeia, 29/NF 24. The official compendia of standard Asian Edition, 2006, 3050-3053 [14] ICH –Guidelines Q2A, Validation of Analytical Procedures: Definition and terminology. [15] (CPMP III/5626/94) March (1995) Geneva, Switzerland. ICH –Guidelines Q2B, Validation of Analytical Procedures: Methodology, (CPMP/ICH/281/95) November (1996) Geneva, Switzerland. [16] Carstensen J. T., Rhodes C.T., Drug Stability Principles and Practices, 3rd Edn, Dekkar Series. to develop analytical method for 424