Download

1 / 7
70 likes | 83 Views
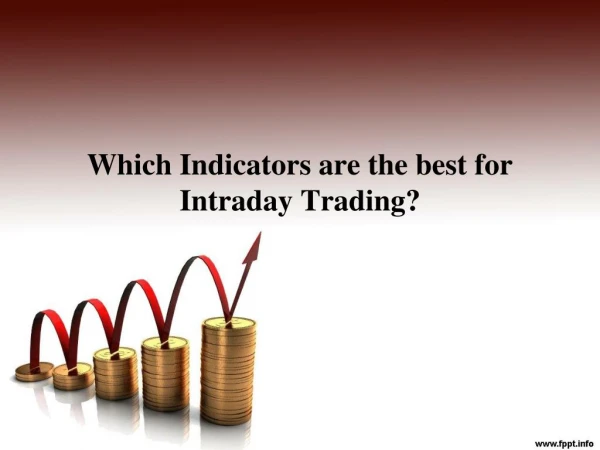
Intraday traders realize how crucial trustworthy indications are. Which one should you choose? It's a complex question with no easy answer. Some traders swear by oscillators like the Relative Strength Index (RSI), while others prefer Bollinger Bands or Moving Average Convergence Divergence (MACD). We'll break down each indicator in this tutorial to help you choose the right one for your trading style and goals. Learn how to trade intraday! for more details visit https://stockventure.in/which-is-the-best-indicator-for-intraday-trading<br><br>

E N D
Which is the Best Indicators for Intraday Trading Introduction to Intraday Trading Indicators Introduction to Intraday Trading Indicators Intraday trading indicators are tools that traders use to analyse market trends and make smart decisions about buying and selling stocks within a single trading day. These indicators provide signals based on many different factors like price, volume, and volatility, which can help traders in identifying possible entry and exit positions. Want to improve your intraday trading strategies? If so, you've landed in the right place! This blog will discuss the best indicators for intraday trading and how to use them to improve your day trading performance. Adding these indicators to your trading routine can provide you with valuable insights and help you make smart trading decisions, despite your trading experience. There are numerous indicators for day trading, but not all work equally. Depending on the trader's style and preferences, some indicators are more effective than others. We have compiled a list of the best technical indicators for day trading that can provide you with valuable insights and help you make better trading decisions in order to assist you in navigating the sea of options. Here Are the Top 10 tips to Invest In Stock Market
Types of Types of Intraday Trading Indicators Intraday Trading Indicators In the stock market, traders mainly use two types of indicators: • • Lagging Indicators Leading indicators Lagging Indicators A lagging indicator is one that is based on historical price data and provides indications after a trend or pattern has formed. Traders sometimes refer to lagging indicators, such as Moving Average, MACD, Bollinger Band, etc., as trend-following indicators, as they confirm previously observed trends. Leading Indicators A leading indicator is a tool that predicts the future direction of a market, allowing traders to predict market movements ahead of time. In theory, if a leading indicator signals correctly, a trader can enter the market before it moves and ride the entire trend such as RSI 5 Best Technical Indicators for Intraday Trading in 2023 1. Super Trend Super Trend Indicator: You may consider it one of the best indicators for day trading because people mostly use it for only intraday trading. It is a popular tool for technical analysis that is used to spot possible trend reversals and figure out when to enter and leave the stock markets. It is a trend-following indicator that is used in many markets, such as stocks, forex, commodities, and cryptocurrencies. The Average True Range (ATR) is the idea on which the SuperTrend indicator is built. Volatility is used to figure out where to put the lines on the price chart. There are two lines on the indicator: • SuperTrend Upper Line: By multiplying the Average True Range (ATR) with the price's moving average, you can determine the SuperTrend Upper Line. The multiplier is usually set to 3 by default, but it can be changed to suit the trader's preferences or the market being studied. The upper line of the SuperTrend shows the possible upper limit of the current trend. • SuperTrend Lower Line: The SuperTrend lower line is found by taking the moving average of the price and subtracting a multiple of the Average True Range (ATR). Most of the time, the ratio is set to 3, but it can be
changed if needed. The lower line of the SuperTrend shows the possible lower limit of the current trend. The SuperTrend indicator tells you when to buy or sell based on when the price crosses over the SuperTrend lines. When the price goes above the SuperTrend upper line, it sends a "buy" alert, which could be a sign of a bullish trend or an opportunity to buy. On the other hand, when the price moves below the SuperTrend lower line, it sends a sell signal, which could mean a bearish trend or a chance to sell. 2. Moving Average Whether they're large fish or tiny retail traders, most traders and investors use this indicator. This is a technical indicator that market analysts and investors can use to figure out the direction of a trend. It adds up all the data points for financial security over a certain time period and splits the total by the number of data points to get an average. Since it receives constant updates with the most recent price data, traders refer to it as a "moving average."
Analysts use the moving average to examine support and resistance by evaluating the movements of an asset’s price. A moving average shows how a security's price has changed in the past. Analysts or buyers can then use the information to figure out where the asset price might go. It's considered a "lagging indicator" since it reveals a trend after the stock's price action. 3. Relative Strength Index (RSI) Relative Strength Index (RSI): RSI is one of the best indicators for intraday trading used in technical analysis to measure the speed and strength of a financial instrument's price change. It goes from 0 to 100 and is used to tell when a security has been overbought or oversold. RSI values above 70 indicate overbought markets, while below 30 indicate oversold markets. Traders can use the RSI to spot trend shifts or buy or sell when it crosses thresholds. • Divergence in RSI: This is when the direction of the RSI indicator doesn't match the direction of the price change. RSI difference comes in two forms:
• Bullish Divergence: The price of an investment is going down, but the RSI makes a higher high and is going in an upward direction. This is a bullish divergence. This can be a sign of a possible change from a downtrend to an uptrend. It shows that bullish momentum may be building and that a price change to the upside may be coming soon. • Bearish Divergence: A bearish divergence happens when the price of the stock makes a higher high, but the RSI goes down. This can be a sign of a possible change from an uptrend to a downtrend. It shows that bearish momentum may be building and that a price drop may be coming soon. 4. Bollinger Band The Bollinger Band is a widely-used indicator in the financial markets. It uses three lines on a price chart to determine an asset's volatility and potential upside or downside. Bollinger Bands are used to look at how prices change over time and find possible price trends. When the price moves outside the bands, it may indicate additional volatility and a trend continuation or reversal. Traders utilize Bollinger Bands to identify overbought or oversold prices, breakouts, breakdowns, and price goals.
The following typically make up Bollinger Bands: • Middle Band: The middle band is a simple moving average (SMA) that is usually set to 20 days, but other time periods can be used. Traders use it as a reference point to determine the "average" price of the financial instrument. • Upper Band: The upper band is formed by adding to the middle band a multiple (usually 2) of the standard deviation of the price of the financial instrument. Traders call the upper band a resistance level, as it indicates the upper limit of the price range. • Lower Band: To figure out the lower band, you take the middle band and take away a multiple (usually 2) of the price's standard deviation. The lower band represents the bottom of the potential price range and traders consider it a level of support. 5. MACD Moving Average Convergence Divergence (MACD) is a common technical analysis indicator for financial market momentum and trend reversals. MACD is usually used on price charts to find possible signs to buy or sell.
There are two lines and a histogram that make up the MACD indicator: • MACD Line: The MACD line is found by taking the shorter Exponential Moving Average (EMA) and subtracting it from the longer Exponential Moving Average (EMA). The default settings for the short-term and long-term EMAs are 12 and 26 periods, respectively. The MACD line is drawn on the price chart to show when momentum is changing. Signal Line: The signal line is a 9-period Exponential Moving Average (EMA) of the MACD line. It is also called the Trigger Line. It appears next to the MACD line and is used to tell traders what to do. Buying may be a smart idea when the MACD line rises over the signal line. When the MACD line crosses below the signal line, it sends out a bearish warning. This could be a good time to sell. • The difference between the MACD line and the signal line is the histogram. It looks like a set of bars above and below the zero line, with positive values showing momentum in the direction of buying and negative values showing momentum in the direction of selling. The histogram is a graph that shows how strong the momentum is. The MACD indicator is used to determine trend changes and overbought or oversold conditions. Traders may enter or exit deals based on histogram changes and MACD crosses. You might be interested in our best stock trading course for intraday: Stock Venture Live Mentorship Author's recommended blog: Intraday Trading In Stock Market