How Minitab Revolutionize Statistical Analysis in Social Science Research
0 likes | 15 Views
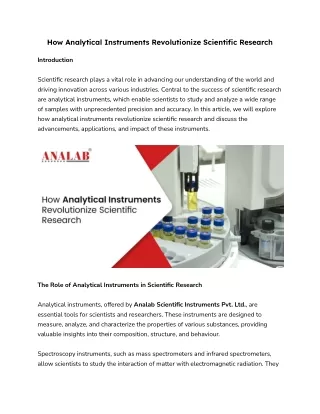
Minitab is a powerful statistical software designed specifically for data analysis. It offers a comprehensive suite of tools for statistical analysis, process control, and data visualization, making it ideal for both academic and professional use. Students always look for top-notch MINITAB homework help for a good academic record.

How Minitab Revolutionize Statistical Analysis in Social Science Research
E N D
Presentation Transcript
HOW MINITAB REVOLUTIONIZE STATISTICAL ANALYSIS IN SOCIAL SCIENCE RESEARCH
MINITAB? WHAT IS MINITAB is a Statistical software used for for comprehensive data analysis It’s Known for its user-friendly interface and robust analytical capabilities Key Features: Extensive suite of statistical tools High-quality data visualization Efficient data management
IMPORTANCE OF DATA ANALYSIS IN SOCIAL SCIENCE Data Analysis Goals: Understanding complex social phenomena Testing and validating hypotheses Informing policy and practice Challenges Addressed by Minitab: Handling large datasets Ensuring statistical accuracy Visualizing complex data
GETTING STARTED WITH MINITAB Installation and Setup: Downloading Minitab System requirements Initial setup steps Interface Overview: Navigation through menus and toolbars Importing data (CSV, Excel) Overview of worksheets and data entry
DATA PREPARATION & CLEANING Data Preparation: Importing and organizing datasets Cleaning data: addressing missing values, duplicates, and errors Transforming data: creating and recoding variables Minitab Tools for Data Preparation: Data cleaning functions Data transformation tools
DESCRIPTIVE STATISTICS IN MINITAB Key Descriptive Statistics: Measures of central tendency (mean, median, mode) Measures of dispersion (range, variance, standard deviation) Distribution analysis (skewness, kurtosis) Generating Descriptive Statistics: Step-by-step guide in Minitab Interpreting the output
EXPLORATORY DATA ANALYSIS (EDA) Purpose of EDA: Identifying patterns and relationships Detecting anomalies and outliers EDA Techniques in Minitab: Histograms Boxplots Scatter plots Conducting EDA: Steps to create and customize visualizations in Minitab
HYPOTHESIS TESTING Introduction to Hypothesis Testing: Running Hypothesis Tests in Minitab: Selecting the appropriate test Interpreting the results Types of Tests: T-tests (one-sample, two-sample, paired) Chi-square tests ANOVA Null and alternative hypotheses Significance levels (p-values)
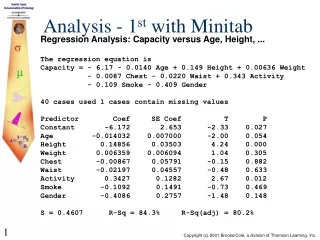
REGRESSION ANALYSIS Types of Regression: Regression Analysis in Minitab: Fitting regression models Checking model assumptions Interpreting regression output (coefficients, R-squared, p- values) Simple linear regression Multiple regression Logistic regression 4 5 0 5 H O N E Y W E L L C O U R T D H L 0 8 1 0 - 2 0 6 1 D A Y T O N , O H 4 5 4 2 4 , U S W W W . S T A T I S T I C S H E L P D E S K . C O M
ADVANCED STATISTICAL TECHNIQUES Multivariate Analysis: Principal Component Analysis (PCA) Cluster Analysis Factor Analysis Time Series Analysis: Identifying trends and seasonal patterns ARIMA models Conducting Advanced Analyses in Minitab: Accessing and using multivariate tools Performing time series analysis
CASE STUDY: SOCIAL SCIENCE RESEARCH Research Scenario: Example of a social science research project Data Analysis Process: Data collection and preparation Descriptive and inferential statistics Regression and advanced analyses Key Findings and Insights: Summarizing the results Implications for social science research 4 5 0 5 H O N E Y W E L L C O U R T D H L 0 8 1 0 - 2 0 6 1 D A Y T O N , O H 4 5 4 2 4 , U S W W W . S T A T I S T I C S H E L P D E S K . C O M
BEST PRACTICES FOR USING MINITAB Data Integrity: Effective Communication: Statistical Validity: Ensuring accurate data entry Regularly validating data Choosing the right statistical tests Avoiding common pitfalls (e.g., overfitting, p-hacking) Presenting results clearly and concisely Using visual aids effectively
RESOURCES FOR FURTHER LEARNING Official Minitab Resources: Help and support documentation Online tutorials and webinars Additional Learning Materials: Books and academic journals Online courses and training sessions
Q & A Open Discussion: Invite questions and provide detailed answers Encourage sharing of experiences and challenges Are you a student with MINITAB subject? If so, you must be looking for assignment help for academic success. No worries. You can communicate with us for the best MINITAB homework help. We ensure complete accurate solutions and on time delivery. 4 5 0 5 H O N E Y W E L L C O U R T D H L 0 8 1 0 - 2 0 6 1 D A Y T O N , O H 4 5 4 2 4 , U S W W W . S T A T I S T I C S H E L P D E S K . C O M
CONCLUSION Recap of Key Points: Final Thoughts: The transformative power of Minitab in social science research Practical steps for utilizing Minitab's capabilities Encouragement to adopt Minitab for robust data analysis Contact information for further inquiries
THANK YOU +44-166-626-0813 homework@statisticshelpdesk.com www.statisticshelpdesk.com 4505 Honeywell Court DHL0810-2061 Dayton, OH 45424, US