Creating Interactive Dashboards in SAS with PROC TABULATE
Learn how to create interactive dashboards in SAS using PROC TABULATE. This guide offers SAS help for students in statistics and biostatistics.


Creating Interactive Dashboards in SAS with PROC TABULATE
E N D
Presentation Transcript
CREATING INTERACTIVE DASHBOARDS IN SAS WITH PROC TABULATE A Practical Guide for Statistics and Biostatistics Students www.statisticshelpdesk.com
2 WHY PROC TABULATE IS A GAME-CHANGER FOR SAS DASHBOARDS When working with SAS, you’ve probably encountered the need to summarise and present your data in a structured way. Whether you’re analysing clinical trial results, survey responses or experimental data, having a clear interactive dashboard makes it easier to interpret your findings. That’s where PROC TABULATE comes in. It’s a powerful yet underutilised procedure that helps you create multi-dimensional tables, organise data efficiently and format results in a presentation ready format. While it’s often overshadowed by PROC REPORT, PROC TABULATE excels at handling hierarchical data and structured summaries. In this article we’ll walk you through how to use PROC TABULATE to create interactive dashboards in SAS, with examples.
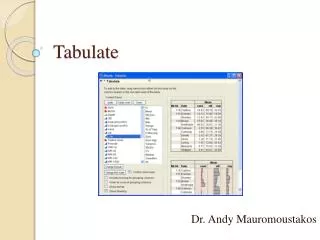
BREAKING DOWN PROC TABULATE: THE BUILDING BLOCKS YOU NEED TO KNOW PROC TABULATE follows a structured syntax that allows you to define rows, columns and summary statistics easily. Let’s start with the basics: code What’s Happening in This Code? proc tabulate data=sashelp.class; class sex; var age height weight; table sex, (age height weight)*(mean std); run; • class sex; – This defines sex as a categorical variable for grouping. • var age height weight; – These are numeric variables for which we want summary statistics. • table sex, (age height weight) (mean std);* – This creates a structured table with mean and standard deviation for age, height and weight, grouped by sex. • The output? A neat table that displays summary statistics, perfect for inclusion in reports or dashboards.
TAKING IT FURTHER: ENHANCING PROC TABULATE FOR INTERACTIVE DASHBOARDS While PROC TABULATE itself doesn’t create dynamic dashboards, you can use ODS (Output Delivery System)and Excel to make the output more interactive. Exporting PROC TABULATE Results to an Interactive Excel Dashboard ods excel file="dashboard.xlsx" options(sheet_name="Summary" embedded_titles='yes'); proc tabulate data=sashelp.class; class sex; var age height weight; table sex all, (age height weight)*(n mean std min max) / box='Summary Statistics'; run; ods excel close;
TAKING IT FURTHER: ENHANCING PROC TABULATE FOR INTERACTIVE DASHBOARDS (CONTD..) What’s Different Here? • ODS EXCEL: This exports the results into an Excel file. • options(sheet_name="Summary"): Names the sheet “Summary” for better organization. • / box='Summary Statistics': Adds a title to the output table for clarity. This will generate structured reports that can be shared, formatted and modified in Excel – bringing interactivity to PROC TABULATE outputs.
MAKING DASHBOARDS LIVE WITH PROC TABULATE AND ODS HTML If you want a web based interactive report ODS HTML is the way to go. code ods html file="dashboard.html" style=htmlblue; proc tabulate data=sashelp.class; class sex; var age height weight; table sex all, (age height weight)*(n mean std min max) / box='Summary Stats'; run; ods html close; This will create a web based report with a clean interactive table that can be embedded into dashboards or shared via a browser.
CUSTOMIZE PROC TABULATE: MAKE YOUR DASHBOARDS MORE READABLE AND PRETTY PROC TABULATE doesn’t have to be boring. You can customise headers, formats and alignment to make your dashboard look good. code • What’s New Here: • PROC FORMAT: Labels the sex variable with meaningful values instead of numbers. • style=journal: Uses a different theme to make it more readable. • Custom Number Formats (f=8.2): Controls the decimal places for better presentation. • These little changes make a big difference in the final output and make your dashboards more user friendly. proc format; value sexfmt 1 = 'Male' 2 = 'Female'; run; ods html file="styled_dashboard.html" style=journal; proc tabulate data=sashelp.class; class sex; var age height weight; format sex sexfmt.; table sex all='Overall', (age height weight)*(n*f=8. mean*f=8.2 std*f=8.2); run; ods html close;
FINAL THOUGHTS: WHY EVERY STATISTICS STUDENT SHOULD MASTER PROC TABULATE Every student of statistics and biostatistics must master PROC TABULATE for achieving their goals. PROC TABULATE serves as a valuable SAS tool which provides superior value to students analyzing clinical data and conducting epidemiology investigations and large-scale surveys. The tool provides versatile data summary presentation structures that become interactive dashboards when combined with ODS EXCEL or ODS HTML. If you're looking for SAS help for students, mastering PROC TABULATE is a great step toward producing professional-quality reports with minimal effort. Procedural TABULATE techniques enhance all types of data presentation including academic displays and industrial reports and basic data examination projects. You should begin your practical work now with the techniques learned so far. Test these examples using your dataset while modifying the visual layouts before making interactive dashboards of your own.
Statistics Helpdesk | 2025 THANK YOU www.statisticshelpdesk.com