Download

1 / 18
180 likes | 204 Views
Do you want to learn R for data science? If yes then here we have mentioned the basic statistics for R to get started with data science.

E N D
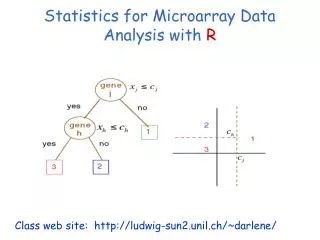
The Most Important Statistics for R to Get Started With Data Science WWW.STATANALYTICA.COM
Today's Discussion • Overview • Statistics R Package • Qualitative Data • Quantitative Data • Probability Distributions • Interval Estimation • Hypothesis Testing • Type II Error • Inference About Two Populations • ANOVA • Non-parametric Methods • Simple Linear Regression • Multiple Linear Regression • Logistic Regression • Conclusion
Overview R is one of the leading programming languages for data science. And we know that data science requires strong command over statistics. Therefore statistics for R become crucial for the data science students. Statistics involves a variety of problems that can be solved manually. But R makes it a lot easier and quicker to solve these statistics problems. All you need to have good command over R to solve the most statistics problems in no time. R is offering the best and highly efficient statistics environment to the statisticians. That is the reason it is known as statistics R language. R provides a variety of functions that help the data scientist to perform statistics and probability functions i.e., parametric distributions, compute summary statistics, and many more. Here in this blog, we are going to share with you everything about statistics with R. But before we start with the statistics for r. Let’s have a look at statistics r packages.
Statistics R Package • Hmisc package • pastecs package • psych package • doBy package • Data.table Packages • Zoo package • maptools package • Caret package • Multcomp package • Vcd package • Glmnet package • Ggplot2 package • dplyr package • Tidyr package • Haven package • Foreign package
Qualitative Data Quantitative Data For qualitative data analysis, we use the RDQA package in R and freely available to the users. It is a free qualitative analysis software application under the BSD license which works on almost every operating system i.e., Windows, Linux, Mac OSX. You can use it comfortably for qualitative data analysis. But keep in mind that it only sports the pain text formatted data. Quantitative data are those datasets that support the arithmetic operations. It is also known as continuous data. R offers a variety of tools and packages for quantitative data analysis. The quantitative data can be numerical, as well as the fractional dataset. It will automatically arrange the data as per the requirements.
Probability Distributions R makes the probability distributions quite more comfortable than the standard approach. We can characterize the function of probability from different functions. Most of the time, we take the density and the distribution functions of probability. It is used to compute theoretical quantiles as well as for sample observations. This would help if you did not have any external package in R for the probability distribution. It can be possible with built in functions i.e., dname, pname, qname, rname. Probability Distribution
Interval Estimation We use Interval Estimation when we have the common requirement to efficiently estimate population parameters that are simply the random sample data. R also offers the built in functions for Interval estimation statistics in R.
Hypothesis Testing Hypothesis Testing Most of the time, the researchers reject hypotheses. It is usually based on the measurements of observed samples that is the statistical mechanism known as hypothesis testing. When the null hypothesis is true, then the type I error rejects the hypothesis. Apart from that, when we need to omit the portability of type 1 error, then we use the significance level of hypothesis testing i.e., shown as Greek letter α. R has extensive support for hypothesis testing.
Type II Error Type II Error Type II error occurs when we fail in rejecting an invalid, null hypothesis. The approach is truly based on the parametric estimate of the region. You can’t reject the null hypothesis in type II error. Besides, you can also handle the type II error in r with the built in functions.
Inference About Two Populations Inference About Two Populations is used to conclude the difference between two populations based on their data samples. It is quite handy and fast to perform inference about two populations in R programming. Inference About Two Populations
ANOVA When we need to compare the mean of multiple groups, we use ANOVA in R. One of the most straightforward cases of ANOVA is the data organized into several groups. And all these groups are based on single grouping factors. It is quite easy to implement ANOVA statistics with R programming.
Non-parametric Methods Non-parametric Methods The non-parametric methods in statistics make no assumptions on the population distribution of sample size. It usually assumed that the data is qualitative, and the population has a normal distribution with sufficiently larger samples.
Simple Linear Regression Simple Linear Regression We use the Linear regression to predict outcome variable value Y based on one or more input predictor variables X. The motive behind the linear regression is to establish the linear relation between the predictor variable and the response variable. It helps us to get the formula the user can use to estimate the value of the response y when we know the predictor’s values only. For this, we use the lm( ) function.
Multiple Linear Regression Multiple Linear Regression The multiple regression in R is just a small step away from the simple linear regression. R offers the lm() function to do multiple regression in R. The only difference in the use of lm function in these two regressions is the addition of more predictors.
Logistic Regression Logistic Regression The other name of logistic regression is the logit model. It is used to model the dichotomous outcome variables. We use it to model dichotomous outcome variables. It is used to measure the relationship between the categorical dependent variable and more independent variables. R offers the best packages for linear regression. Thus it has become quite handy to implement linear regression statistics in R.
Conclusion Now you may be quite confident that the statisticians prefer R over other languages for statistics. You can save plenty of time to solve the most complex statistics problems with R. Keep in mind that you can quickly start with R programming if you have a decent command over statistics and basic programming knowledge. If you want to get start learning data science, then you should clear the basics of statistics for R to start your journey of data science with R.
FACEBOOK TWITTER PINTEREST @statanalytica @statanalytica @statanalytica FOLLOW US ON SOCIAL MEDIA
WEBSITE EMAIL www.statanalytica.com info@statanalytica.com Contact Us