Download
1 / 5
50 likes | 72 Views
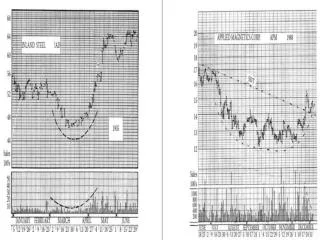
A set of trendlines define the technical analysis tools called as Bollinger Bands. There are 2 standard deviations, positive and negative, staying remotely from a simple moving average (SMA) of an assets price. However, it can be adjusted as per the needs of clients. John Bollinger was the person behind the development of the tool. He also filed for its copyright. It helps in designing opportunities for traders and achieving success in the financial market. <br><br>

E N D
Introduction to Bollinger bands, Keltner Channeland their Best use in trading in2021 trendingbrokers.com/keltner-channel A set of trendlines define the technical analysistools called as Bollinger Bands. There are 2 standard deviations, positive and negative, staying remotely from a simple moving average (SMA) of an assets price. However, it can be adjusted as per the needs ofclients. John Bollinger was the person behind the development of the tool. He also filed forits copyright. It helps in designing opportunities for traders and achieving success in the financialmarket. It identifies the probability of assets, whether they were overbought or oversold in the market. On the other hand, Keltner Channel is an indicator used for technical analysis.It displays the channel line along with the central moving average line at a distance below and above. The indicator was named after Chester W. Keltner. He described the phenomenon in hisbook. People who heard about the indicator from the man himself started using the term. However, some say he didn’t claim any idea for the original idea. As per Keltner, it is a10- day moving average rule for trading. According to him, the central line was a simple moving average of ten days of the typical price. That price is the average of low, high and close. Process of calculating BollingerBands
One has to compute the simple moving average (SMA) of an asset or security available.It is advisable to use a 20-day SMA, as it helps average out the closing price, inthe beginning, twenty days. It is for the first data point. Interestingly, the next datapoint would be dropping at the earliest rate. You can add the price on the 21st day and getthe average. It continues that way. The security’s price standard deviation will be obtained next. Standard deviation can be termed as average variance mathematical measurementthat prominently features in finance, accounting, economics andstatistics. For a particular data set, the job of a standard deviation is to measure how averagevalue is causing spread out numbers. You can find the variance’s square root. That is complexto calculate. That’s the average of the difference of the squares of themean. Now, it is important to multiply the value of standard deviation by two. Then it is essential to subtract and add that amount along the SMA from each point. Thoseproduce lower and upperbands. Why are Bollinger Bondsimportant? Bollinger Bands are an unspeakably famous technique used by traders. Manyinvestors believe that the overbought market is directly proportional to the prices moving closerto the upper band. And if the prices move toward the lower band, that exhibits theoversold market. A set of 22 such rules were followed by John Bollinger when he used bands as a tradingsystem. Calculation in Keltnerchannel Traders can calculate the Keltner channel following the followingtypes: Start by selecting the exponential moving average’slength. Now, choose the ATR’s(Average True Range) timeperiods. Then select the multiplier forATR The ATR represents the basic volatility setting. There are various short timeframes like10 that are capable of producing vast, volatile ATR. As a result, there is a fluctuation of 10- period volatility. On the other side, the longer time frames like 100 iron out these fluctuations and produce better and constant ATRreadings. The channel width sees the biggest effect by the multiplier. By changing it from twoto one, the width of the channel will be cut inhalf. On the other side, if it is increased from 2 to 3, there will be a 50 per cent jump inthe channelwidth. The squeeze on BollingerBands
The squeeze acts as the Bollinger Bands’ central concept. When the bands come soclose that they start constricting the moving average, that situation is called a squeeze.A indicates the low volatility. It shows the potential of future trading opportunities andis seen as a signal of future increasedvolatility. On the contrary, the more the bands grow, there’s a burgeoning chance of decreasing volatility. Thus, that’s an opportunity to exit the trade. Meanwhile, a trader shouldnot consider these conditions as tradingsignals. The price does not indicate the direction change or movement of themarket. Breakouts in BollingerBands Interestingly, the maximum price action, approximately ninety per cent of them,happens between the two bands. Any breakout that takes place below or above the bandsis considered a major event. However, investors’ biggest mistake is considering the price hitting one of the bands as the chance to sell or buy assets. The breakouts offer noclue regarding the direction and the movement of the futureprice. Bollinger Bandslimitations One must know that Bollinger Bands do not work as a standalone trading system.Instead, they provide traders and investors with information regarding price volatility. Thus, it is essential that people do not fall for the single indicator and use others. That helps in offering different data for locating accurate signals for trading in the market. Someof them picked by John Bollinger are MACDand RSI. He favoured these techniques foron- balancevolume. They get computed from SMA (Simple Moving Average). Moreover, they similarlyweigh old price data as the new one. It means that outdated data may dilute thenew information. Moreover, the use of two standard deviations and 20-day SMA seems arbitrary to an extent. Thus, that may not function smoothly in every situation or condition as required. It is the sole responsibility of traders to adjust their standard deviation and SMAthrough assumptions and find ways for theadjustments. Keltner channel methods andusage Traders can utilise the Keltner channel in multiple ways as they please. It all dependson the settings used by the user. The bigger lag in the indicator is directly proportional to a longer EMA. The channel won’t display any change to the price change in that case.On the flip side, the shorter EMA reflects that the bands react swiftly to price changes. However, a trader can’t depict the direction of the trend. Thus, that can maketrading slightlydifficult.
A larger channel may occur if a bigger multiplier creates the ATR. The bands will behit less often by the price. A band will be close together if the multiplier is smaller.Moreover, the price will exceed the bands or reachthem. Traders can use the following methods to deploy the potential Keltnerchannels:- A plunge below the lower band exhibits the price weakness. Moreover, itindicates the downtrend, precisely when the angle of the channel isdownward. The channel’s angle assists in identifying the direction of the trend. For example,if the channel is rising, that will mean so are the prices. On the other hand,the sideways channel or falling displays a regular fall in prices or moving sideways. If the price hits the upper band continuously but does not do that with thelower band; however, when the price reaches the lower band, that would mean the uptrend is endingshortly. The price strength is showcased by when the price moves above the upper band.It would mean that the uptrend is in the fray, more so when the channel’s angle is upwards. Moreover, if the price keeps on hitting the lower band, without reaching theupper band, and when it finally picks up to hit the upper band, that would mean that the downtrend of the market is finallyending. There may be chances that the price may oscillate between upper and lowerbands. In such situations, traders have the opportunity to utilise bands as resistance and support. They can prefer buying when the prices are low or reach the lowerband. When it goes higher, people have a chance to short that asset. When the pricesstart to plunge again, that’s the time to purchase. The cycle continues. It againreaches the upper band and plunges back, creating situations for bettertrading. If the price breaks below or above the channel after the sideways period. And when it begins to angle in a similar way, it would mean a new signal is underway. That’sa breakoutdirection. Bollinger Bands v/s KeltnerChannels One may find both the indicators quite similar. Bollinger Bands utilise the standard deviation while Keltner Channels use ATR for calculating the lower and upperbands. Traders can interpret that in their possibilities. However, since the methodsof calculations are slightly different, the end results that may come can be distinct.So, traders need to pay attention to that aspect oftrading. Limitations KeltnerChannel The setting of the Keltner Channel ensures its usefulness for traders. Thus, it is up to the users how they brought into use the indicator for their investment purposes. Hence,their approach should be nuanced for making better profits. However, the KeltnerChannel won’t work smoothly if the bands are too far apart ornarrow.
Keltner Channel works great in conjunction with analysis of price action,technical indicators and fundamental analysis while working for a longterm. Moreover, Keltner Channel can offer some trade signals besides identifying thetrend direction. Meanwhile, the band may not act as resistance or support. Also, there may be a little ability of forecasting, that’s not too helpful for traders. Moreover, there’s noguarantee that the price hitting one band or two ATRs will yield the results required by a trader. Thus, there’s no promise of something significant happening fortraders. Conclusion Both Keltner Channels and Bollinger Bands are important indicators for a trader. Thus, an investor should study them appropriately before deciding to use them toacknowledge the market’s direction. When used together, both indicators can exhibitbetter information to a trader. However, their calculations are different, so that aspectshould also be kept in mind before going for an investment. You can start your trading journey with the most trusted brokerage firmPrimeFin.