Download
1 / 6
60 likes | 205 Views
The last decade has been a challenge for many investors, especially those investing for the long term and retirement. Given declines in global stock markets, many investors have seen little to no real growth in their portfolios over this period. This Wealth Guide explains why investors

E N D
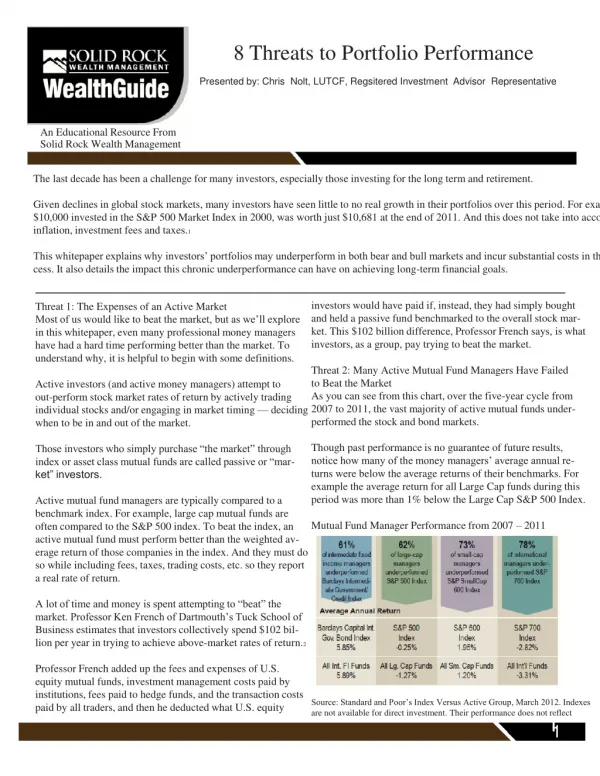
8 Threats to Portfolio Performance Presented by: Chris Nolt, LUTCF, Regsitered Investment Advisor Representative An Educational Resource From Solid Rock Wealth Management The last decade has been a challenge for many investors, especially those investing for the long term and retirement. Given declines in global stock markets, many investors have seen little to no real growth in their portfolios over this period. For example, $10,000 invested in the S&P 500 Market Index in 2000, was worth just $10,681 at the end of 2011. And this does not take into account inflation, investment fees and taxes.1 This whitepaper explains why investors’ portfolios may underperform in both bear and bull markets and incur substantial costs in the pro- cess. It also details the impact this chronic underperformance can have on achieving long-term financial goals. investors would have paid if, instead, they had simply bought Threat 1: The Expenses of an Active Market and held a passive fund benchmarked to the overall stock mar- Most of us would like to beat the market, but as we’ll explore ket. This $102 billion difference, Professor French says, is what in this whitepaper, even many professional money managers investors, as a group, pay trying to beat the market. have had a hard time performing better than the market. To understand why, it is helpful to begin with some definitions. Threat 2: Many Active Mutual Fund Managers Have Failed to Beat the Market Active investors (and active money managers) attempt to As you can see from this chart, over the five-year cycle from out-perform stock market rates of return by actively trading 2007 to 2011, the vast majority of active mutual funds under- individual stocks and/or engaging in market timing — deciding performed the stock and bond markets. when to be in and out of the market. Though past performance is no guarantee of future results, Those investors who simply purchase “the market” through notice how many of the money managers’ average annual re- index or asset class mutual funds are called passive or “mar- turns were below the average returns of their benchmarks. For ket” investors. example the average return for all Large Cap funds during this period was more than 1% below the Large Cap S&P 500 Index. Active mutual fund managers are typically compared to a benchmark index. For example, large cap mutual funds are Mutual Fund Manager Performance from 2007 – 2011 often compared to the S&P 500 index. To beat the index, an active mutual fund must perform better than the weighted av- erage return of those companies in the index. And they must do so while including fees, taxes, trading costs, etc. so they report a real rate of return. A lot of time and money is spent attempting to “beat” the market. Professor Ken French of Dartmouth’s Tuck School of Business estimates that investors collectively spend $102 bil- lion per year in trying to achieve above-market rates of return.2 Professor French added up the fees and expenses of U.S. equity mutual funds, investment management costs paid by institutions, fees paid to hedge funds, and the transaction costs Source: Standard and Poor’s Index Versus Active Group, March 2012. Indexes paid by all traders, and then he deducted what U.S. equity are not available for direct investment. Their performance does not reflect 1 1
years now. the expenses associated with the management of an actual portfolio. The fund returns used are net of fees, exclud- ing loads. Returns are based upon equal-weighted fund counts. The data assumes reinvestment of income and Their May 2009 Indices Versus Active Funds Study specifically does not account for taxes or transaction costs. The risks associated with focuses on the bear market of 2008 and concludes that “the stocks potentially include increased volatility (up and down movement in the belief that bear markets favor active management is a myth.”5 value of your assets) and loss of principal. Bonds are subject to risks, includ- ing interest rate risk which can decrease the value of a bond as interest rates rise. Investing in foreign securities may involve certain additional risks, In the same study, Standard and Poor’s identified similar results including exchange rate fluctuations, less liquidity, greater volatility, different for the 2000 to 2002 bear market. In both that bear market and financial and accounting standards and political instability. Past performance the one in 2008, a majority of active funds underperformed their is not a guarantee of future results. respective S&P Index for all U.S. and international equity asset classes. In aggregate in 2008, actively managed funds under- While some managers were able to beat the market, this performed the S&P 500 Index by an average of 1.67%.6 raises the question: was it luck or skill? One of the greatest challenges for active managers is the Universe of Active Mutual Fund Managers 1975-2006 extreme difficulty in forecasting the economy or accurately predicting the market’s direction in advance. This makes it hard for them to anticipate bear and bull markets. In fact, Wall Street has a notoriously bad forecasting record: its consensus forecast has failed to predict a single recession in the last 30 years.7 Looking back on the forecasts made for the markets at the beginning of 2008, just before the greatest bear market since the Great Depression, many of them turned out to be quite optimistic. .6% outperformed their benchmark due to skill At the end of 2007, Newsday gathered market predictions from “eight major Wall Street Securities firms” and found an av- erage price target for the S&P 500 by year-end 2008 of 1,653, In a 2008 research study3 — perhaps the most compre- representing a 12% increase over 2007. And at the beginning of hensive ever performed — Professors Barras, Scaillet, and 2008, USA Today similarly surveyed nine Wall Street invest- Wermers used advanced statistical analysis, to evaluate the ment strategists. They were a little less optimistic, expecting an performance of active mutual funds. They looked at fund per- average price target for the S&P 500 for the year of 1606, only formance over a 32-year period, from 1975-2006. an 8.6% increase. Of course, we now know that the S&P 500 Index declined by 37% in 2008. And many of those major Wall The study concluded that after expenses, only 0.6% (1 in Street firms experienced their own unforeseen troubles, includ- 160) of active mutual funds actually outperformed the market ing being sold or merged. through the money manager’s skill. If Wall Street experts can’t even predict recessions or the This low number “can’t eliminate the possibility that the few direction of the market, it is questionable how active managers [funds] that did were merely false positives,” just lucky, in can successfully pick individual stocks, in bear markets or bull other words, according to Professor Wermers.4 markets, especially since a stock’s performance is often very sensitive to economic and market conditions. Threat 3: Few Active Mutual Funds Have Outperformed in Bear Markets Threat 4: Only a Few Stocks Have Generated Some have claimed that active managers have a distinct ad- Strong Long-Term Returns Over The Last 20 Years vantage in bear markets. They can get out of troubled stocks The performance of individual stocks differs greatly even though and sectors early and avoid the worst of a downturn. stocks collectively have historically provided strong returns over long investment horizons. Standard and Poor’s has been measuring the performance of active managers against their index counterparts for several 2 2
Looking at the University of Chicago’s CRSP total market Threat 5: Missing the Best Days in the Market Can Lower equity database as representative of the U.S. market for the Returns period 1926-2011, only the top-performing 25% of stocks Many active investors try to move much or all of their money out were responsible for the market gains during this timeframe. of the market when they believe a bear market or down cycle The remaining 75% of the stocks in the total market database is imminent. However, this may result in missing not just down collectively generated a loss of -0.7%. This example demon- days but some of the best (most bullish) days in the markets as strates the difficulty in selecting the individual stocks that will well. perform better or even in-line with the broad equity market. It is important to note that past performance in any security is This mistake can be dangerous to your wealth! not indicative of future results. Missing even a few of the best days of the market can have a substantial impact on a portfolio. If you had invested $100,000 in 1970, it would be worth $5,066,200 in 2011. Missing just five of the best days would have cut your returns by almost $1.8 million to $3,294,000.8 No one knows when those “best days” will happen, yet some people prefer to try and ride out a bear market by pulling out of the market or just staying uninvested on the sidelines. Even if you’d missed just one day — the single best day — between 1970 and 2011, you would have made a $500,000 mistake. Results based on the CRSP 1-10 Index. CRSP data provided by the Center for Research in Security Prices, University of Chicago. Threat 6: Lack of Patience and Discipline Can Be Costly As the chart below shows, a study by the research organization Past performance is not indicative of future results. Indexes are unmanaged baskets of securities in which investors cannot directly invest. The data Dalbar found that from 1992 – 2011, the average investor did assume reinvestment of all dividend and capital gain distributions; they do substantially worse than major indices. Sometimes, we really not include the effect of any taxes, transaction costs or fees charged by an can be our own worst enemies. Up and down markets can be investment advisor or other service provider to an individual account. The emotional events, but as the study found, letting emotion affect risks associated with stocks potentially include increased volatility (up and your investing can be very damaging. down movement in the value of your assets) and loss of principal. Small company stocks may be subject to a higher degree of market risk than the securities of more established companies because they tend to be more In this study, the average investor returns were calculated as volatile and less liquid. the change in assets after excluding sales, redemptions and ex- changes during the period. This method of calculation captures One might ask: if a small percentage of stocks could possibly realized and unrealized capital gains, dividends, interest, trading account for the market’s long-term returns, why not avoid all costs, sales charges, fees, expenses, and any other costs. the headaches and just invest in these top-performing stocks? According to this study, the average equity investor had an- Since past performance is not indicative of future results, a nual returns of just 3.5% during this time frame. Over the same portfolio of even the most carefully chosen stocks could easily period, the S&P 500 returned an annual average of 7.8%. This wind up with none of the best-performing stocks in the mar- almost 55% decrease in average annual returns experienced by ket— and thus could possibly produce flat or negative returns the average investor is the cost of not exercising patience and for many years. As the performance of active managers versus discipline, of letting emotion guide investing instead of reason. indices shows, very few managers are accomplished stock pickers. Even in fixed income, investors made expensive mistakes. While the Barclay’s Aggregate Bond Index returned 6.5% over this Missing out on even a handful of the top-performing stocks period, the average fixed income investor had an annual return can leave you well short of market returns. According to an of .94%, underperforming even inflation. article by William J. Bernstein in Money Magazine (05/09), the only way you can be assured of owning all of tomorrow’s top- performing stock is to own the entire market. 3 3
Average Investor vs. Major Indices 1992 – 2011 are not properly compensated for. Markets can be chaotic, but over time they have shown a strong relationship between risk and reward. This means that the com- pensation for taking on increased levels of risk is the potential to earn greater returns. According to academic research by Pro- fessors Eugene Fama and Ken French, there are three “factors” or sources of potentially higher returns with higher correspond- ing risks.9 1. Invest in Stocks 2. Emphasize Small Companies 3. Emphasize Value Companies Average stock investor and average bond investor performances were used A groundbreaking study by leading institutional money manager, from a DALBAR study, Quantitative Analysis of Investor Behavior (QAIB), Dimensional Fund Advisors LP, found that exposure to these 03/2012. QAIB calculates investor returns as the change in assets after three risk factors accounts for over 96% of the variation in excluding sales, redemptions, and exchanges. This method of calculation portfolio returns.10 captures realized and unrealized capital gains, dividends, interest, trading costs, sales charges, fees, expenses, and any other costs. After calculating investor returns in dollar terms (above), two percentages are calculated: So, the presence or absence of Small and Value companies in Total investor return rate for the period and annualized investor return rate. your portfolio as well as your exposure to stocks may have a Total return rate is determined by calculating the investor return dollars as a substantial impact on performance. And additional asset class- percentage of the net of the sales, redemptions, and exchanges for the pe- es, such as Real Estate and International, help provide further riod. The fact that buy-and-hold has been a successful strategy in the past does not guarantee that it will continue to be successful in the future. portfolio diversification. Threat 7: Lack of Diversification To take a historical example: As the chart below shows, $1 “Don’t put all of your eggs in one basket.” invested in 2002 in a diversified equity portfolio including ex- posure to Small, Value, Real Estate, International and Emerging As an investor, you may have heard this old saying used to Markets was worth $1.78 at the end of 2011. emphasize the need for a diversified portfolio. Growth of $1 Investment Diversified Equity Portfolio Though diversification does not guarantee a profit or protect January 1, 2002 - December 31, 2011 against a loss, a combination of asset classes may reduce your portfolio’s sensitivity to market swings because different assets — such as bonds and stocks — have tended to react differently to adverse events. For example, the stock and bond markets have historically tended not to move in the same direction; and even when they did, they usually did not move to the same degree. Some long-term investors believe that investment success has less to do with how well you pick individual stocks or the tim- ing of when you get in the markets and more to do with how well your portfolio has been diversified. Just owning 10 different mutual or index funds, for example, Diversified Equity Portfolio is weighted as 21% to the Dow Jones Total Market does not mean you are effectively diversified. These mutual Index, 18% to the Russell 1000 Value Index, 15% to the Russell 2000 (Small funds may have similar holdings or follow similar investment Cap) Index, 26% to the MSCI EAFE Index (net div), 10%to the MSCI EAFE Small styles. Cap Index, 5%to the MSCI Emerging Markets Index, and 5% to the Dow Jones U.S. Select REIT IndexData Sources: S&P 500 Index data are provided by Standard & Poor’s Index Services Group, Russell Index data provided by The In addition, investors who are not properly diversified may Russell Company, www.russell.com Dow Jones Wilshire Index data provided have more risk in their portfolio or are taking risks that they by www.dowjo- nesindexl.com; MSCI Index data provided by Morgan Stanley 4 4
Capital International Group Inc. www.mscibarra.com (January 2012). But planning, especially done with professional help, can make Indexes are unmanaged baskets of securities in which investors cannot a real difference. directly invest. Actual investment results may vary. All investments involve risk,including loss of principal. Past performance is not indicative of future Outlining your goals, identifying your risk tolerance, and set- results. Foreign securities involve additional risks, including foreign currency changes, political risks, foreign taxes, and different methods of accounting ting expectations can help you stay focused on your investment and financial reporting. strategy through bull and bear markets and strong and weak economic environments. $1.78 may not seem particularly impressive...until you com- pare it to the S&P 500, which returned only $1.33 over the These are no small matters. You don’t get many chances to plan same period. This 25% difference in returns is a powerful and execute your long-term financial goals. illustration of the value of broad diversification, especially dur- ing one of the worst decades for equities in modern history. Many prudent investors believe that the point of investing isn’t to aim for the highest possible returns, but rather to generate The risks associated with stocks potentially include increased volatility (up returns necessary to meet their long-term goals at an accept- and down move- ment in the value of your assets) and loss of principal. Small company stocks may be subject to a higher degree of market risk able risk level. Attempting to enhance your returns by seeking than the securities of more established companies because they tend to out the needles in the haystack introduces an additional layer of be more volatile and less liquid. Investing in foreign securities may involve active risk and the potential for increased volatility. certain additional risks, including exchange rate fluctuations, less liquidity, greater volatility, different financial and accounting standards and political So what should you do? Each investor’s situation is unique, but instability. Real estate securities funds are sub- ject to changes in economic conditions, credit risk and interest rate fluctuations. Bonds and fixed income given the challenges and expenses of active management, put- funds will decrease in value as interest rates rise. ting together a sound plan that entails holding a well-diversified portfolio and not trying to beat the market may be the prudent Threat 8: No Plan approach in attempting to achieve your long-term financial As the saying goes: “Failing to plan is planning to fail.” If you goals. don’t know where you are going, how are you going to get there? We hope you will act on the information shared in this Wealth Guide to help accomplish your goals. While retirement is a major concern for many investors, 45% of adult Americans have no plan in place whatsoever. 11 S&P 500 Index data are provided by Standard & Poor’s Index Services Group. Indexes are unmanaged baskets of securities in which investors 1 cannot directly invest. Actual investment results may vary. All investments involve risk, including loss of principal. Past performance is not indica- tive of future results. Kenneth R. French, “The Cost of Active Investing,” March 2008. 2 Barras, Laurent, Scaillet ,Wermers, and Russ, “False Discoveries in Mutual Fund Performance: Measuring Luck in Estimated Alphas” (May 2008). 3 Robert H. Smith School Research Paper No. RHS 06-043 Available at SSRN: http://ssrn.com/abstract=869748 Mark Hulbert, “The Prescient Are Few,” The New York Times (July 13, 2008) 4 Standard and Poor’s Investment Service, May 2009 5 Ibid. 6 New York Times, May 5, 2009 7 Performance data for January 1970-August 2009 provided by CRSP; performance data for September 2009-December 2011 provided by Bloom- 8 berg. The S&P data are provided by Standard & Poor’s Index Services Group. CRSP data provided by the Center for Research in Security Prices, University of Chicago. US bonds and bills data © Stocks, Bonds, Bills, and Inflation Yearbook™, Ibbotson Associates, Chicago (annually updated work by Roger G. Ibbotson and Rex A. Sinquefield). Indexes are not available for direct investment. The data assumes reinvestment of income and does not account for taxes or transaction costs. Past performance is not a guarantee of future results. There is always the risk that an investor may lose money. Cross Section of Expected Stock Returns, Eugene F. Fama and Kenneth R. French, Journal of Finance 47 (1992) 9 Dimensional Fund Advisors study (2002) of 44 institutional equity pension plans with $452 billion total assets. Factor analysis run over various 10 time periods, averaging nine years. Total assets based on total plan dollar amounts as of year end 2001. Northwestern Mutual Market Research, April 2012 11 Whitepaper created by LWI Financial Inc. (“Loring Ward”). Securities offered through Loring Ward Securities Inc. Member FINRA/SIPC B 12-021 (05/12). 5 5
Chris Nolt is the owner of Solid Rock Wealth Management and Solid Rock Realty Advisors, LLC, located in Bozeman, Montana. Solid Rock Wealth Management is an independent, fee-based wealth management firm that provides investment consulting plus other wealth management services for high net worth individuals and families. Solid Rock Wealth Management uses a comprehensive planning approach with a team of financial professionals which addresses retirement planning, investment planning, estate planning, tax planning, risk management, wealth pres- ervation and other components. Solid Rock Realty Advisors, LLC assists investors who are seeking secure income producing real estate investments. We specialize in office buildings leased to the U.S. Federal Government and primarily work with investors who are purchasing properties through a 1031 tax-deferred exchange. For the acquisition and management of these properties, we have teamed up with two national firms who for the last 18 years have focused exclusively on the U.S. Federal Government Agency real estate market. Chris grew up in Lewistown, Montana and received a Bachelors degree in business from Montana State University in 1987. Chris entered the financial services industry in 1989 and for the last 24 years has been helping people with their investment, retirement and estate planning needs. Chris is passionate about helping people grow and preserve their wealth and he has built many long lasting relationships over the years with his sincere educational approach. He has earned the designations of Certified Retirement Financial Advisor, Certified Senior Advisor and Life Underwriter Training Council Fellow. He holds series 7, 66 and 24 securities licenses, as well as a Montana insurance license and a Montana real estate license. An avid outdoorsman and devoted Christian, Chris lives in Bozeman. For more information or to request other Wealth Guides, call 406-582-1264 or send an e-mail to: chris@solidrockwealth.com. Solid Rock Wealth Management and Solid Rock Realty Advisors, LLC 2020 Charlotte Street, Bozeman, MT 59718 • 406-582-1264 www.solidrockwealth.com www.solidrockproperty.com Securities and advisory services offered through Independent Financial Group, LLC, a registered broker-dealer and investment advisor. Member FINRA/SIPC. Solid Rock Wealth Management and Solid Rock Realty Advisors, LLC are not affiliated entities of Independent Financial Group, LLC. 7 6