Probability Density Function With Example | Probability And Statistics Tutorial
This presentation on Probability distribution will explain the concept of Probability Density Function with Examples. Learn what the probability density function is and implement it yourself in python by following along with this Probability and Statistics tutorial. At the end of this video, you will be able to find the probability density function of any sample with ease<br><br>The topics covered in this video are :<br>1. What is Probability Distribution Function?<br>2. Steps to find Probability Distribution Function

Probability Density Function With Example | Probability And Statistics Tutorial
E N D
Presentation Transcript
What’s in it for you? What is Probability Density Function? Steps to find Probability Density Function Summarize density with histogram Parametric Density Estimation Non-Parametric Density Estimation • S
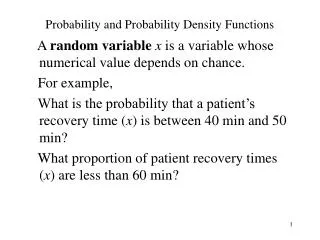
What is Probability Density Function?
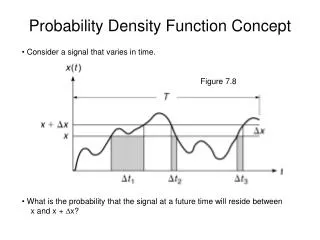
What is Probability Density Function? A function which defines the relationship between a random variable and its probability, such that you can find the probability of the variable using the function is called a Probability Density Function (PDF). Consider a variable x with a pdf of f(x) P(a) ≤ X ≤ P(b) f(x) P(b) b a x Probability Density Function
What is Probability Density Function? Continuous Random Variable Discrete Random Variable A variable which can only take in a value within a certain range. The value is usually within a certain distance of another finite value, eg : Sum of two dice A continuous random variable is one which can take on infinite different values within a range of values, eg : Height of a student
What is Probability Density Function? Consider the graph below which shows the rainfall distribution in a year in a city. The x-axis has the rainfall in inches and the y-axis has the probability density function. The probability of some amount of rainfall is obtained by finding area of curve on the left of it P(Y = 3) ≤ 0.5 f(x) 0.5 3 x Amount of rain
1. Summarize Density with Histogram We first convert the data into discrete form by plotting it as a histogram. A histogram is a graph which has categorical values on x-axis and bins of different heights which give us a count of the values in that category Histogram
1. Summarize Density with Histogram The number of bins is important as It determines how may bars the histogram will have and their width. This will determine how our density will be plotted Histogram of previous data with bin size 4
2. Parametric Density Estimation • To check if our histogram is a good fit to the function, we can: • Plot the density function and compare histogram shape • Compare samples of the function with real samples • Use a statistical test A probability density function is of many types. The shape of the histogram will help us determine which type of function it is. We can calculate the parameters associated with the function to get our density Probability density function is normal distribution
3. Non-Parametric Density Estimation In cases where the shape of our histogram doesn’t match a common probability density function, or cannot be made to fit one, we calculate the density using all samples in our data using certain algorithms Random Distribution
3. Non-Parametric Density Estimation • Commonly used terms for non-parametric estimation are : • Kernel Density Estimation : Uses a mathematical function to calculate and smooth probabilities so that their sum is always 1 • Smoothing Parameter (bandwidth) : Controls the number of sample which are used to estimate the probability for a new point • Basis Function: Used to control distribution of sample Probability density function for random distribution
Join us to learn more! simplilearn.com UNITED STATES Simplilearn Solutions Pvt. Limited 201 Spear Street, Suite 1100 San Francisco, CA 94105 Phone: (415) 741-3319 INDIA Simplilearn Solutions Pvt. Limited #53/1C, 24th Main, 2nd Sector HSR Layout, Bangalore 560102 Phone: +91 8069999471 UNITED STATES Simplilearn Solutions Pvt. Limited 801 Corporate Center Drive, Suite 138 Raleigh, NC 27607 Phone: (919) 205-5565