1 / 4

NCERT Solutions for Class 8 Science Chapter 3

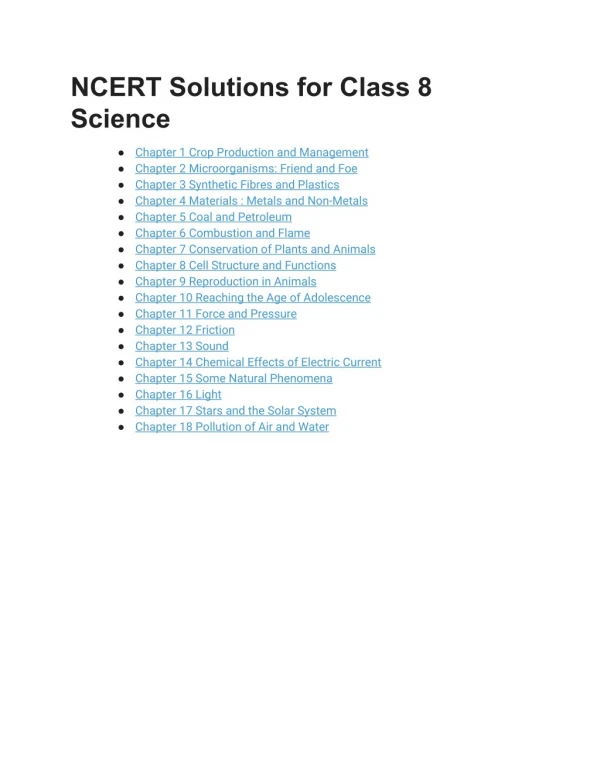
Explore NCERT Solutions for Class 8 Science Chapter 3, focusing on the formation, extraction, and uses of coal and petroleum.

Shruti110
Download Presentation

NCERT Solutions for Class 8 Science Chapter 3

An Image/Link below is provided (as is) to download presentation Download Policy: Content on the Website is provided to you AS IS for your information and personal use and may not be sold / licensed / shared on other websites without getting consent from its author. Content is provided to you AS IS for your information and personal use only. Download presentation by click this link. While downloading, if for some reason you are not able to download a presentation, the publisher may have deleted the file from their server. During download, if you can't get a presentation, the file might be deleted by the publisher.

E N D

Presentation Transcript


  1. 3.Coal and Petrolium Coal and petroleum are both classified as exhaustible natural resources, meaning they can’t be replaced once used. They are also called fossil fuels because they are formed from the dead remains of plants and animals millions of years ago. Coal is a black, hard substance found buried underground. It is used as a fuel for cooking, generating electricity in power plants, and in various industries. The process of coal formation from dead plant matter buried under high pressure and temperature for a long time is called carbonization. Petroleum is a liquid natural resource found underground. It is a mixture of various useful products like petrol, diesel, kerosene, and LPG. The refining process separates these products from crude oil. Petroleum is used as fuel in vehicles and for many other purposes. Both coal and petroleum are important resources, but since they are limited, we should use them judiciously and explore alternate sources of energy. NCERT Solutions for Class 8 Science Chapter 3 Q1. What are the advantages of using CNG and LPG as fuels? Ans: CNG and LPG are cleaner burning fuels that are cheaper and easier to transport, making them attractive alternatives. Q2. Name the petroleum product used for surfacing roads. Ans: The petroleum product used for surfacing roads is called bitumen. It’s also sometimes referred to as asphalt. Q3. Describe how coal is formed from dead vegetation. What is this process called? Ans: Dead plant matter gets buried deep, squeezed by pressure, and cooked by Earth’s heat for millions of years. This slow process with limited oxygen turns plants into coal. It’s called carbonization. Q4. Fill in the blanks: (a) Fossils fuels are ____ , ____ and ____

  2. (b) Process of separation of different constituents from petroleum is called ______ (c) Least polluting fuel for vehicle is ______ Ans: (a) Fossil fuels are coal, petroleum, and natural gas. (b) Process of separation of different constituents from petroleum is called refining. (c) Least polluting fuel for vehicle is CNG (Compressed Natural Gas) Q5. Tick True/False against the following statements. (a) Fossil fuels can be made in the laboratory. (b) CNG is more polluting fuel than petrol. (c) Coke is an almost pure form of carbon. (d) Coal tar is a mixture of various substances. (e) Kerosene is not a fossil fuel. Ans: (a) False (b) False (c) True (d) True (e) False Q6. Explain why fossil fuels are exhaustible natural resources.

  3. Ans: Fossil fuels take millions of years to form naturally, but we’re using them up much faster. We can’t make more quickly, so they’ll eventually run out. Q7.Describe the characteristics and uses of coke. Ans: Coke: ● Characteristics: ○ Almost pure carbon ○ Tough, black, and porous substance ○ Burns without smoke ● Uses: ○ Fuel: Used in industries and for power generation (historically more common) ○ Metal extraction: Acts as a reducing agent to extract metals from their ores ○ Steel manufacturing: A key ingredient in steel production Q8. Explain the process of the formation of petroleum. Ans: Microscopic sea life die and sink, get buried by sediment, and are cooked by heat and pressure for millions of years. This lack of oxygen breaks them down into oil and gas. Q9. he following table shows the total power shortage in India from 2004-2010. Show the data in the form of a graph. Piet shortage percentage for the years on the y-axis and the year on the x-axis. Ans: Sure, here is the graph:

More Related