Download
1 / 22
220 likes | 447 Views
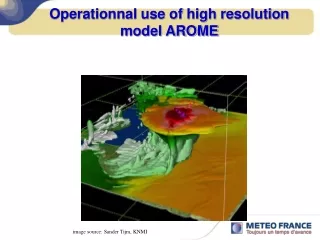
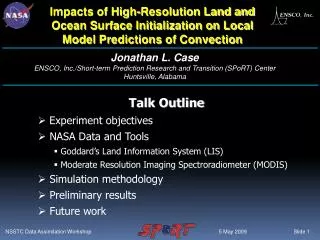
Impacts of High-Resolution Land and Ocean Surface Initialization on Local Model Predictions of Convection. Jonathan L. Case ENSCO, Inc./Short-term Prediction Research and Transition (SPoRT) Center Huntsville, Alabama. Talk Outline Experiment objectives NASA Data and Tools

E N D
Impacts of High-Resolution Land and Ocean Surface Initialization on Local Model Predictions of Convection Jonathan L. Case ENSCO, Inc./Short-term Prediction Research and Transition (SPoRT) Center Huntsville, Alabama • Talk Outline • Experiment objectives • NASA Data and Tools • Goddard’s Land Information System (LIS) • Moderate Resolution Imaging Spectroradiometer (MODIS) • Simulation methodology • Preliminary results • Future work
Hypothesis and Experiment Objectives Hypothesis: High-resolution land and water datasets from NASA utilities can lead to improvements in simulated summertimepulse-type convection over the S.E. U.S. Experiment objectives Use NASA LIS to provide high-resolution land surface initializations Incorporate SPoRT MODIS composites for detailed representation of sea surface temperatures (SSTs) Demonstrate proof of concept in using these datasets in local model applications with the Weather Research and Forecasting (WRF) model Quantify possible improvements to WRF simulations
NASA Land Information System (LIS) High-performance land surface modeling and data assimilation system Runs a variety of Land Surface Models (LSMs) Integrates satellite, ground, and reanalysis data to force LSMs in offline mode Can run coupled to Advanced Research WRF Data assimilation capability (EnKF) built-in Modular framework enables easy substitution ofdatasets, LSMs, forcings, etc. Adopted by AFWA for operational use in WRF Previous SPoRT work with LIS Case et al. (2008) manuscript in J. Hydrometeor. Quantified positive impacts to WRF forecasts over Florida by initializing model with LIS land surface output Focused on verification of primary meteorological variables
Land Surface Modeling with LIS Inputs Physics Outputs Applications Topography, Soils Land Surface Models (e.g. Noah, VIC, SIB, SHEELS) Soil Moisture & Temp Weather/ Climate Water Resources Homeland Security Military Ops Natural Hazards Land Cover, Vegetation Properties Evaporation Meteorology (Atmospheric Forcing) Runoff Data Assimilation Modules Snow Soil Moisture Temperature Snowpack Properties
MODIS SST Product RTG OSTIA MODIS Once daily 1/12 degree resolution Once daily 5-km resolution Four times daily 1-km resolution • MODIS provides superior resolution • Quality check with the latency product • Current weakness is high latency in areas with persistent cloud cover • Collaboration with Jet Propulsion Laboratory to improve product with AMSR-E data MODIS Latency Product
Experiment Design Run parallel WRF simulations Once daily 27-h simulations, initialized at 0300 UTC Control: Initial / boundary conditions from NCEP 12-km NAM model Experimental: Same as Control, except Replace land surface data with LIS output fields Replace SSTs with SPoRT MODIS composites Evaluation and Verification Graphical and subjective comparisons Verification using Meteorological Evaluation Tools (MET) package Developed by WRF Development Testbed Center Standard point/grid verification statistics Method for Object-Based Diagnostic Evaluation (MODE) Object-oriented, non-traditional verification method Summer convective precipitation verification
WRF Model Configuration Model domain over Southeastern U.S. Advanced Research WRF v3.0.1.1 4-km horizontal grid spacing 39 sigma-p levels from surface to 50 mb Min. spacing near surface of 0.004 sigma Max. spacing of 0.034 sigma Positive definite advection of scalars Model physics options Radiation: Dudhia SW and RRTM LW Microphysics: WSM6 Land Surface: Noah LSM (same as LIS) PBL: MYJ scheme Cumulus parameterization: None ny = 311 nx = 309
LIS Offline “Spin-up” Run LIS/Noah LSM run from 1 Jan 2004 to 1 Sep 2008 Same soil and vegetation parameters as in WRF Atmospheric forcing 3-hourly Global Data Assimilation System analyses Hourly Stage IV radar + gauge precipitation products Run long enough to allow soil to reach equilibrium state Output GRIB-1 files to initialize WRF land surface variables Incorporation of LIS data into WRF initial condition Slight modifications to WRF Preprocessing System (WPS) Created Vtable.LIS & added LIS fields into METGRID.TBL file Soil moisture/temperature, skin temp, snow-water, land-sea mask LIS data over-write NAM land surface data Similarly, MODIS SSTs over-write NAM / RTG SSTs in WPS
Precip Verification with MET / MODE • Traditional grid point verification • Bias, threat score, HSS at various accumulation intervals / thresholds • Neighborhood precipitation verification • Occurrence of precipitation threshold in a “box” surrounding a grid point • Relaxes stringency and determines model skill at distance thresholds • MODE object classification • Resolves objects through convolution thresholding: • Filter function applied to raw data using a tunable radius of influence • Filtered field thresholded (tunable parameter) to create mask field • Raw data restored to objects where mask meets/exceeds threshold • For our study, MODE is run with: • 1-h, 3-h accumulated precipitation • 5 mm, 10 mm, and 25 mm thresholds • Radius of influence = 12 km (produced best object “matching”)
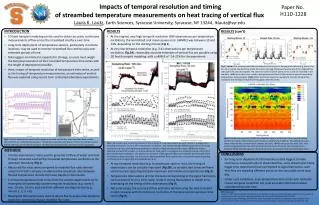
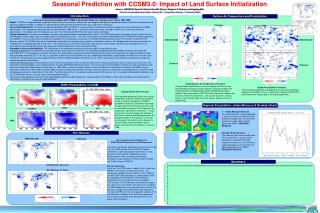
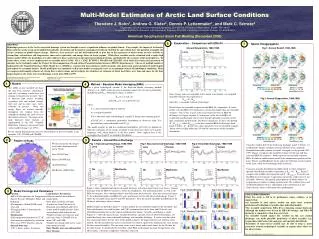
1 June 2008 Sensitivity Example:0-10 cm Soil Moisture Differences Control (NAM) LIS LIS – NAM
1 June 2008 Sensitivity Example:SST Differences MODIS Control (RTG) MODIS – RTG
1 June 2008 Sensitivity Example:WRF 3-h Precip Diffs (06z to 06z) Control LIS LIS – CNTL Stage IV
1 June 2008 Sensitivity Example:MODE 5-mm / 3-h precip “Objects” Control LISMOD
Precip Verification: Jun-Aug 2008 • WRF has high bias • LISMOD reduces bias some, esp. during daylight hours (12-24 h) • WRF generally has low skill (Heidke SS, right) • LISMOD incrementally improves skill, esp. at higher thresholds
MODE Precip Object Verification 3-h Accumulated Precip Objects 1-h Accumulated Precip Objects
Summary / Future Work Simulation methodology using NASA data and tools Land Information System land surface data MODIS SST composites Provides high-resolution representation of land/water surface, consistent with local & regional modeling applications Ongoing / Future efforts Conduct rigorous model verification Use MET to generate objective statistics and object-oriented output for precipitation Evaluate how combined NASA surface datasets can lead to improved short-term local model forecasts of convection NASA / SPoRT website: http://weather.msfc.nasa.gov/sport/
LIS High-Level Overview • Data Assimilation • Soil moisture • LST, Snow cover LSM First Guess / Initial Conditions Uncoupled or Analysis Mode Coupled or Forecast Mode Station Data WRF Global, Regional Forecasts and (Re-) Analyses ESMF LSM Physics (e.g. Noah, VIC, SIB,SHEELS) Satellite Products
SPoRT MODIS SST Composites Real-time, 1-km SST product Composites available up to four times per day 0400, 0700, 1600, and 1900 UTC Primarily over Gulf of Mexico, western Atlantic waters, and larger lakes (e.g. Florida’s Lake Okeechobee) GRIB-1 files posted to publicly available ftp site Sub-sampled to 2-km spacing for model applications Compositing technique Build complete SST composite with multiple Earth Observing System satellite passes (both Aqua and Terra) At each pixel, examine 5 most recent readings: Take average of 3 warmest readings This method helps to eliminate cloud contamination