Download
1 / 1
10 likes | 28 Views
An open-ended equity scheme following investment theme of investing in recently listed 100 companies or upcoming Initial Public Offer (IPOs), click here.

E N D
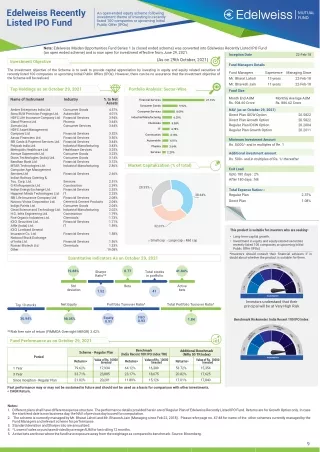
Edelweiss Recently Listed IPO Fund An open-ended equity scheme following investment theme of investing in recently listed 100 companies or upcoming Initial Public Offer (IPOs) Note: Edelweiss Maiden Opportunities Fund Series 1 (a closed ended scheme) was converted into Edelweiss Recently Listed IPO Fund (an open ended scheme) and is now open for investment effective from June 29, 2021. Inception Date 22-Feb-18 (As on 29th October, 2021) Investment Objective Fund Managers Details The investment objective of the Scheme is to seek to provide capital appreciation by investing in equity and equity related securities of recently listed 100 companies or upcoming Initial Public Offers (IPOs). However, there can be no assurance that the investment objective of the Scheme will be realised. Fund Managers Experience Managing Since Mr. Bharat Lahoti Mr. Bhavesh Jain 13 years 11 years 22-Feb-18 22-Feb-18 Top Holdings as on October 29, 2021 Portfolio Analysis: Sector-Wise Fund Size Month End AUM Rs. 904.60 Monthly Average AUM Rs. Crore 886.62 Name of Instrument Industry % to Net Financial Services 27.19% Crore Assets Consumer Goods 9.92% Amber Enterprises India Ltd. Sona BLW Precision Forgings Ltd. HDFC Life Insurance Company Ltd. Financial Services Consumer Goods Automobile 4.57% 4.01% 3.94% NAV (as on October 29, 2021) Direct Plan IDCW Direct Plan Growth Option Regular Plan IDCW Regular Plan Growth Option Consumer Services 8.09% Option 20.5822 20.5822 20.2004 20.2011 Industrial Manufacturing 6.29% Gland Pharma Ltd. Zomato Ltd. Pharma Consumer Services 3.64% 3.64% Chemicals 5.08% Option IT 4.78% HDFC Asset Management Company Ltd. Aavas Financiers Ltd. SBI Cards & Payment Services Ltd. Financial Services Polycab India Ltd. Financial Services Financial Services 3.52% 3.50% 3.44% 3.43% Construction 4.18% Minimum Investment Amount Rs. 5,000/- and in multiples of Re. 1 Automobile 4.01% Industrial Manufacturing Pharma 3.64% Metropolis Healthcare Ltd. Healthcare Services 3.25% Services 2.29% Additional investment amount Rs. 500/- and in multiples of Re. 1/‐thereafter Avenue Supermarts Ltd. Dixon Technologies (India) Ltd. Bandhan Bank Ltd. MTAR Technologies Ltd. Computer Age Management Services Ltd. Indian Railway Catering & Tou. Corp. Ltd. G R Infraprojects Ltd. Indian Energy Exchange Ltd. Consumer Goods Consumer Goods Financial Services Industrial Manufacturing 3.23% 3.14% 3.12% 2.86% Market Capitalization (% of total) Exit Load Financial Services 2.66% Upto 180 days : 2% After 180 days : Nil Services Construction Financial Services 2.51% 2.39% 2.35% 29.35% Total Expense Ratios~: Happiest Minds Technologies Ltd. SBI Life Insurance Company Ltd. Nuvoco Vistas Corporation Ltd. Indigo Paints Ltd. Clean Science and Technology Ltd. Industrial Manufacturing H.G. Infra Engineering Ltd. Fine Organic Industries Ltd. ICICI Securities Ltd. IT Financial Services Cement & Cement Products Consumer Goods 2.25% 2.08% 2.04% 2.04% 2.02% 1.79% 1.73% 1.71% Regular Plan Direct Plan 2.37% 1.08% 38.64% Construction Chemicals Financial Services Affle (India) Ltd. ICICI Lombard General Insurance Co. Ltd. IT 1.59% 32.01% This product is suitable for investors who are seeking* Financial Services 1.58% • Long-term capital growth. • Investment in equity and equity-related securities recently listed 100 companies or upcoming Initial Public Offer (IPOs) *Investors should consult their financial advisers if in doubt about whether the product is suitable for them. National Stock Exchange of India Ltd. Small cap Large cap Mid cap Financial Services 1.56% Rossari Biotech Ltd. Chemicals 1.33% Other 19.08% Quantitative indicators As on October 29, 2021 19.88% 0.77 41.84% Total stocks in portfolio Sharpe Ratio** E T A R E D O M Std. Beta Active bets LOW deviation 1.52 41 RISKOMETER Investors understand that their principal will be at Very High Risk Net Equity Portfolio Turnover Ratio^ Total Portfolio Turnover Ratio^ Top 10 stocks F&O 0.93 Equity 0.91 36.94% 98.05% Benchmark Riskometer: India Recent 100 IPO Index 1.84 **Risk free rate of return (FIMMDA Overnight MIBOR) 3.42% E T A R E D O M Fund Performance as on October 29, 2021 LOW Benchmark Additional Benchmark (Nifty 50 TR Index) Value of Rs. 10000 Scheme - Regular Plan (India Recent 100 IPO Index TRI) Period RISKOMETER Value of Rs. 10000 Invested 17,934 Value of Rs. 10000 Invested 16,389 Returns* Returns* Returns* Invested 15,354 79.62% 64.12% 53.72% 1 Year 3 Year Since Inception - Regular Plan 33.71% 21.02% 23,885 20,201 23.17% 11.89% 18,675 15,126 20.82% 17.01% 17,625 17,840 Past performance may or may not be sustained in future and should not be used as a basis for comparison with other investments. * CAGR Return. Notes: 1. Different plans shall have different expense structure. The performance details provided herein are of Regular Plan of Edelweiss Recently Listed IPO Fund. Returns are for Growth Option only. In case the start/end date is non business day, the NAV of previous day is used for computation. 2. The scheme is currently managed by Mr. Bharat Lahoti and Mr. Bhavesh Jain (Managing since Feb 22, 2018). Please refer page no. 47-48 for name of the other schemes currently managed by the Fund Managers and relevant scheme for performance. 3. Standard deviation and Sharpe ratio are annualized. 4. ^ Lower of sales or purchase divided by average AUM for last rolling 12 months. 5. Active bets are those where the fund have exposure away from the weightage as compared to benchmark. Source: Bloomberg. 9