Download
1 / 4
40 likes | 53 Views
A brief update on Edelweiss Balanced Advantage Fund is provided in this note, along with the factors that have contributed to its performance in recent years.

E N D
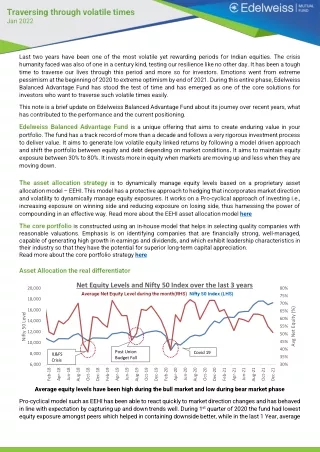
Traversing through volatile times Jan 2022 Last two years have been one of the most volatile yet rewarding periods for Indian equities. The crisis humanity faced was also of one in a century kind, testing our resilience like no other day. It has been a tough time to traverse our lives through this period and more so for investors. Emotions went from extreme pessimism at the beginning of 2020 to extreme optimism by end of 2021. During this entire phase, Edelweiss Balanced Advantage Fund has stood the test of time and has emerged as one of the core solutions for investors who want to traverse such volatile times easily. This note is a brief update on Edelweiss Balanced Advantage Fund about its journey over recent years, what has contributed to the performance and the current positioning. Edelweiss Balanced Advantage Fund is a unique offering that aims to create enduring value in your portfolio. The fund has a track record of more than a decade and follows a very rigorous investment process to deliver value. It aims to generate low volatile equity linked returns by following a model driven approach and shift the portfolio between equity and debt depending on market conditions. It aims to maintain equity exposure between 30% to 80%. It invests more in equity when markets are moving up and less when they are moving down. The asset allocation strategy is to dynamically manage equity levels based on a proprietary asset allocation model – EEHI. This model has a protective approach to hedging that incorporates market direction and volatility to dynamically manage equity exposures. It works on a Pro-cyclical approach of investing i.e., increasing exposure on winning side and reducing exposure on losing side, thus harnessing the power of compounding in an effective way. Read more about the EEHI asset allocation model here The core portfolio is constructed using an in-house model that helps in selecting quality companies with reasonable valuations. Emphasis is on identifying companies that are financially strong, well-managed, capable of generating high growth in earnings and dividends, and which exhibit leadership characteristics in their industry so that they have the potential for superior long-term capital appreciation. Read more about the core portfolio strategy here Asset Allocation the real differentiator Net Equity Levels and Nifty 50 Index over the last 3 years Average Net Equity Level during the month(RHS) Nifty 50 Index (LHS) 20,000 80% 75% 18,000 70% Avg Net Equity (%) 16,000 Nifty 50 Level 65% 60% 14,000 55% 12,000 50% 45% 10,000 40% Post Union Budget Fall Covid 19 8,000 IL&FS Crisis 35% 6,000 30% Jun-18 Jun-19 Jun-20 Jun-21 Apr-18 Apr-19 Aug-19 Apr-20 Apr-21 Dec-18 Dec-19 Dec-20 Dec-21 Feb-18 Aug-18 Feb-19 Feb-20 Aug-20 Feb-21 Aug-21 Oct-18 Oct-19 Oct-20 Oct-21 Average equity levels have been high during the bull market and low during bear market phase Pro-cyclical model such as EEHI has been able to react quickly to market direction changes and has behaved in line with expectation by capturing up and down trends well. During 1st quarter of 2020 the fund had lowest equity exposure amongst peers which helped in containing downside better, while in the last 1 Year, average
Traversing through volatile times Jan 2022 equity level has been higher vs peers which has helped capturing upside better. This has resulted into better performance across overall market cycle from Jan 2020 to Dec 2021. Equity Level Jan- 20 Feb- 20 Mar- 20 Apr- 20 May- 20 Jun- 20 Jul- 20 Aug- 20 Sep- 20 Oct- 20 Nov- 20 Dec- 20 Edelweiss BAF (EBAF)* (%) Nifty returns(%) 59.3 51.7 -6.4 39.8 -23.2 62.7 14.7 58.1 -2.8 69.3 7.5 72.6 7.5 70.4 2.8 59.5 -1.2 65.7 3.5 72.1 11.4 72.1 7.8 -1.7 Equity Level Jan- 21 64.8 Feb- 21 66.1 Mar- 21 59.6 Apr- 21 51.8 May- 21 59.8 Jun- 21 56.8 Jul- 21 59.8 Aug- 21 63.0 Sep- 21 63.0 Oct- 21 62.0 Nov- 21 54.9 Dec- 21 50.96 Edelweiss BAF (EBAF)* (%) Nifty returns(%) Source: ACE MF, Bloomberg.* Equity Level is of average for the month. -2.5 6.6 1.1 -0.4 6.5 0.9 0.3 8.7 2.8 0.3 -3.9 1.09 Long term performancehas been most consistent and in the top quartile. The fund continues to do well on consistency matrix with 100/ 100/ 86 times above median performance on a rolling 3-year basis over last 1, 2 and 3 years. Though the fund has been through ups and down over a short-term period, cumulatively it has been able to deliver a better experience for investors who have continued to stay invested over 3-5 years. The fund has also outperformed its stated benchmark over this period. Performance EBAF Returns Reg(G) (%) 18.8 *returns in Absolute returns for period less than 1 year and CAGR for returns more than 1 year. As of 31st Dec 2021. Source: ACE MF, Bloomberg CY21 CY20 22.6 CY19 7.8 CY18 1.9 CY17 23.9 3Y CAGR 16.2 5Y CAGR 14.6 Scheme Name 1 Year 3 Years 5 Years Edelweiss Balanced Advantage Fund-Reg(G) (%) 18.8 16.2 14.6 Benchmark: NIFTY 50 Hybrid Composite debt 50:50 Index (%) 14.5 14.4 13.1 *returns in Absolute returns for period less than 1 year and CAGR for returns more than 1 year. Data as of 31st Dec 2021. Source: ACE MF, Bloomberg Median 3 Y Rolling Returns Edelweiss Balanced Advantage Fund-Reg(G) (%) NIFTY 50(%) Median 3Y Net Equity Exposure(%) CY21 13.4 13.4 65.0 CY20 7.2 4.5 63.0 Annualized Volatility Nifty 50(%) EBAF(%) CY21 13.8 7.9 CY20 31.1 14.8 Source: ACE MF, Bloomberg, Data as of 31st Dec 2021, returns in Absolute returns for period less than 1 year and CAGR for returns more than 1 year Contribution to performance over the last 3 and 5 years has mainly come from core portfolio. The negative contribution from asset allocation is the insurance cost for protecting your investments during bad years, making investment journey less volatile with reduced drawdown during sharp market downfalls. Like in the 1st Quarter of 2020 when markets were down ~38 while the fund was down only ~15. Approximate Attribution Core Equity Asset Allocation Model Debt & Special Situation 3Y 15.5 -0.8 3.5 5Y 14.5 -1.0 3.4 Source: Internal Analysis, Ace MF, in %, Data as of 31st Dec 2021
Traversing through volatile times Jan 2022 Pro-cyclical model provided an edge. With uncertainty in liquidity and volatile yield behaviour across the globe, asset allocation has become important, and with insufficient data and un-clear insights, a pro-cyclical model usually has an edge over valuation-based models. In last 5 years, we have seen trending markets in 3 out of 5 years, which has been more suitable for our style of asset allocation. Counter-cyclical models on the other hand have underperformed during this period as it continued to lag market changes in valuation paradigm. Pro-cyclical model such as EEHI has been able to react quickly to market directional changes and has behaved in line by expectation with capturing up and down trends well during this period. The model also has helped deliver returns closer to Nifty 50 with ~50 lower volatility, thereby providing more smoother ride to investors. Core Equity portfolio outperformed. It has remained large cap biased and has been able to outperform Nifty over last 1/3/5 years by 8/2/2. The equity portfolio positioning remained defensive with focus on visibility of earnings resulting in Pharma, Consumer Discretionary and Telecom being major OW with respect to Nifty 50. The major sectors contributors to this year’s performance have been IT, BFSI and Metals however better selection in Pharma, IT and BFSI has also helped in outperforming Nifty 50. Equity Performance Core Equity (100 scaled) (%) Nifty 50 (%) 1Y 32.0 24.1 3Y 19.3 16.9 5Y 18.1 16.2 Source: Internal Analysis, Ace MF, Data as of 31st Dec 2021 Debt & Special Situation contributed well.Core debt portfolio yielded 4/5/6.2 returns over 1/3/5 years as we maintained a conservative stance. As yields continue to remain low in 2021, we supplemented it by using cash-future arbitrage strategy to shore up overall blended returns. Special Situations (SS) added 2.7/2.1/1.7 returns to overall fund over last 1/3/5 years. With 64 IPOs listing this year, it remained as one of the major sources of returns in special situation strategy apart from open offers and QIP participation. Current portfolio positioning as on year-end had net equity exposure around 55. Our equity portfolio is tilted towards companies in the technology sector as they have better visibility in earnings growth along with OW positions in selective BFSI and Auto companies where growth is reasonably priced. We remain UW on O&G and transportation sectors. On Debt side, our endeavour is to continue using cash-future arbitrage to support our conservative AAA/GSec portfolio with low to medium duration. We expect there will be enough opportunities in special situation for the fund this year as well, as IPO pipeline remains strong with ~65 companies filing DRHP. What lies ahead? If 2020 was a game of two halves, where we witness both bear and a bull market together in a year, 2021 was simply a period of ‘risk on’ with +24 returns. 2022 has started with concerns around surging cases of omicron, rising inflation and a hawkish tone by the global central banks. As the liquidity normalization begins in CY22; earnings growth will reaming major driver for any incremental gains in equities. With no major negative surprises on economic activity arising from omicron wave, we expect companies to continue to show healthy growth in top-line. On earnings front, quite a few companies will continue to face margin pressures due to input cost pressures. This will result in earnings growth being more gradual; making countercyclical asset allocation model, which is inherently slow in capturing trend reversals, lagging in raising equity levels. We believe Edelweiss Balanced Advantage Fund will traverse through this situation better and will continue to add value in your portfolio. In our view, this fund should be part of the investor’s core portfolio, since it reduces volatility/drawdown substantially without not much reduction in the potential returns.
Traversing through volatile times Jan 2022 Disclaimer: Performance as of 31st Dec 2021: Benchmark (NIFTY 50 Hybrid Composite Debt 50:50 Index) Additional Benchmark (Nifty 50 TR Index) Scheme Value of Rs. 10000 Invested Value of Rs. 10000 Invested Value of Rs. 10000 Invested Period Return Return Return 1 Year 18.76 11,876 14.53 11,453 25.59 12,559 3 Year 16.20 15,697 14.44 14,991 18.27 16,552 5 Year 14.64 19,812 13.05 18,480 17.65 22,561 Since Inception 10.88 35,900 10.94 36,113 12.96 45,165 Past performance may or may not be sustained in future and should not be used as a basis for comparison with other investments. - Returns for 1 year and less are on absolute terms and for more than 1 year are on CAGR terms. - Different plans shall have different expense structures. The performance details provided herein are of Regular Plan of Edelweiss Balanced Advantage Fund. Returns are for Growth Option only. Since Inception returns are calculated on Rs. 10/- invested at inception of the scheme. In case the start/end date is non-business day, the NAV of previous day is used for computation. - The scheme is currently managed by Mr. Bhavesh Jain (Managing this fund from August 7, 2013), Mr. Bharat Lahoti (Managing this fund from September 18, 2017) and Gautam Kaul (managing this fund from December 11, 2017). Data Source: Ace MF, Data as on 31st December 2021 In case the start/end date is non-business day, the NAV of previous day is used for computation. Please click on http://edelweissmf.com/Download/factsheet.aspx for performance of other funds managed by fund manager. For details on other fund managed by Fund manager, please visit https://bit.ly/3IgS9rg Visit www.edelweissmf.com for more information on the fund. Disclaimers: This note is for information purposes only for distributors and does not constitute an offer or recommendation to buy or sell any scheme of Edelweiss Mutual Fund. This presentation also does not constitute an offer or recommendation to buy or sell any financial products offered by Edelweiss. Any action taken by you based on the information contained herein is your responsibility alone and Edelweiss Asset Management Limited (the AMC)/Edelweiss Trusteeship Company Limited/ Edelweiss Mutual Fund or its directors or employees will not be liable in any manner for the consequences of such action taken by you. The AMC takes no responsibility of updating any data/information in this material from time to time. The information shall not be altered in any way, transmitted to, copied or distributed, in part or in whole, to any other person or to the media or reproduced in any form, without prior written consent of the AMC. Edelweiss Balanced Advantage Fund - An open-ended dynamic asset allocation fund Mutual Fund investments are subject to market risks, read all scheme related documents carefully.