Download
1 / 42
420 likes | 685 Views
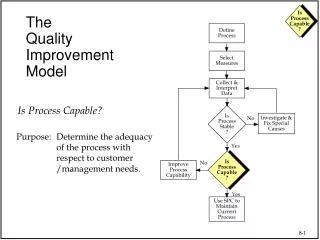
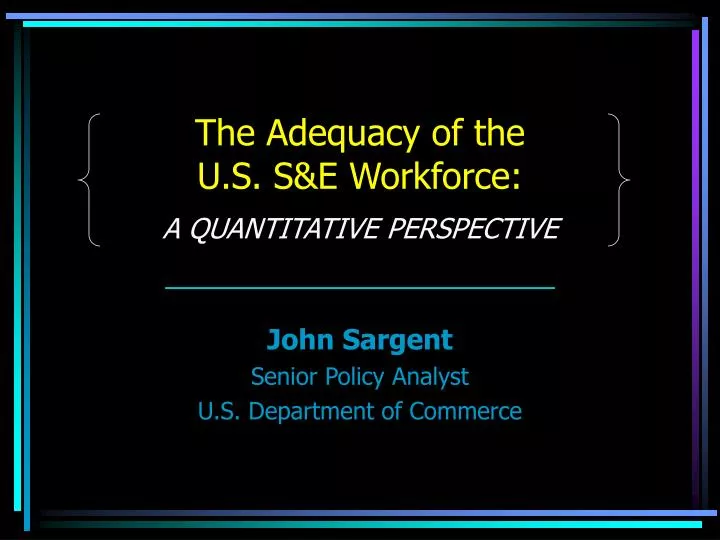
The Adequacy of the U.S. S&E Workforce: A QUANTITATIVE PERSPECTIVE. John Sargent Senior Policy Analyst U.S. Department of Commerce. Alarm Bells…. “… the nation may likely face severe shortages in SET workers…”

E N D
The Adequacy of the U.S. S&E Workforce:A QUANTITATIVE PERSPECTIVE John Sargent Senior Policy Analyst U.S. Department of Commerce
Alarm Bells… • “… the nation may likely face severe shortages in SET workers…” –Land of Plenty, Commission on the Advancement of Women and Minorities in Science, Engineering, and Technology Development (CAWMSET) • “There is a quiet crisis building in the United States [that] stems from the gap between the nation’s growing need for scientists, engineers, and other technically skilled workers, and its production of them.” – The Quiet Crisis: Falling Short in Producing American Scientific and Technical Talent, Building Engineering and Science Talent (BEST) • “… U.S. need for the highest quality human capital in science, mathematics and engineering is not being met.” – Hart-Rudman Commission • "Our 1998 study found a shortage of 346,000 programmers, systems analysts and computer scientists." – ITAA president Harris Miller • "We are not training enough American scientists and engineers to retain our prosperity ...." – American Scientist magazine, 2001 • “a serious deficit of scientists and engineers” resulting in “an evaporating dominance.” – Dan Goldin, former NASA administrator, 2001
Distribution of Projected S&E Job Openings(new jobs plus net replacements)2000-2010
S&E Bachelor’s Degrees Life Sciences Up... ...Engineering, Physical Sciences, and Math Down
Engineering Bachelor’s Degrees…Half Empty or Half Full? …or a 53 percent increase since 1976? A 23 percent decline since 1985…
The Market PerspectiveDegree Production vs. Projected Job Openings
Mathematics and Computer ScienceDegrees & Projected Job Openings
Biological and Agricultural SciencesDegrees & Projected Job Openings
IT Education & Training LandscapeHow IT Workers Get and Maintain their Skills • IT Bachelor’s Degrees • IT-Related Minors • Combined IT Bachelors/Masters Degree Programs • IT-Related Masters of Science Programs • Techno MBAs • Two-Year IT Degrees at Community Colleges • IT Certificate Programs • Private, For-Profit Education and Training Institutions • Vendor and Vendor-neutral IT Certification • Federal, State and Regional IT Training Initiatives • Boot Camps and Seminars • Employer Programs • On-Line, CD-ROM, Books • The Churn
Professional-level IT Workers’ Educational Preparation Largely in the Sciences, Engineering
Possible Niche Areas of Need • Federal S&E Employees: Unique Challenges • Industries Affected by Past/Current Federal Demand • University Professors in High Demand Disciplines • Emerging Disciplines • Converging Disciplines • Industries with Past Workforce Shocks
Challenge to the Community: Analysis • Conduct In-Depth Quantitative, Qualitative Analysis • Separate Niche, Broad Demand • Identify Unique Challenges • Industrial • Regional • Occupational • Level of Education
Challenge to the Community: Action • Math and Science Education in K-12 • Image of Scientists and Engineers • S&E Career Awareness in Middle, High School • Industry Feedback to Post-Secondary Institutions • Post-Secondary Institutions’ Responsiveness to Market Demands • Industry Must Help Itself
Challenges toGrowing Domestic S&E Workforce • Cost-Benefit of Grad Education in S&E vs. Law, Business
Challenges toGrowing Domestic S&E Workforce • Cost-Benefit of Grad Education in S&E vs. Law, Business
Challenges toGrowing Domestic S&E Workforce • Cost-Benefit of Grad Education in S&E vs. Law, Business • Attractiveness of Careers in S&E vs. Law, Business • Strong Emphasis by Other Nations, Cultures on S&E Education • Access to Foreign Labor in the U.S. (H-1B, L1) • Access to Foreign Labor Abroad (Offshoring—direct and through contract) • Significantly lower salary costs • Pools of well-educated S&E talent • Improved national infrastructure, political stability • Large Government, Industry Focus on Health R&D
Factors Supporting U.S. Ability to Grow Domestic S&E Workforce • Premier Academic Research Institutions • Elite Students Among Best in World • Powerful Industrial Base, Potential Partners in S&E Education and Training • Money Talks!
Contact Information John F. Sargent Senior Policy Analyst Office of Technology Policy, Technology Administration U.S. Department of Commerce 202-482-6185 jsargent@ta.doc.gov www.ta.doc.gov
U.S. Population Projections: GenderSteady Growth for Males and Females Through 2100
Women’s Share of MEPS Bachelor’s Degrees Growing, Still Comparatively Low
Share of Bachelor’s Degrees in Each Field Earned by Women, 2000
Underrepresented Minorities’ Share of Total U.S. S&E Bachelor’s Degrees
U.S. Population Projections: Numbers By Race, EthnicitySharp Increase in Hispanics; Substantial Increase in Asians; Moderate Increase in Blacks; Whites, American Indians Constant
U.S. Population Projections: Racial and Ethnic CompositionSteep Decline in Percentage of Whites; Sharp Increase in Hispanics; Substantial Increase in Asians; Moderate Decline in Blacks; American Indians Constant
Strong correlation between Federal R&D investments in MEPS and bachelor’s degree production in MEPS fields Federal R&D, Non-Biomedical constant (1996)B$ Federal R&D, Non-Biomedical constant (1996)B$
IT Applications Computer Chip Design Help Desk Software Engineering Software Design Programming IT Hardware Systems Integration Software Systems Integration E-commerce Supply-Chain Management Data Mining Offshoring: IT on Leading Edge
Home Loan Processing Radiology Insurance Claim Processing Scientific Information Research Accounting Financial Analysis Engineering Design Product Design Employee Benefits Tax Accounting Architectural Work R&D Airline Reservation and Customer Service Credit Card/Loan Processing IT Not Alone
India China Russia Poland Mexico Czech Republic Poland Philippines Hungary Costa Rica Brazil Where is the Work Going?
Factors Driving Interest in Offshoring Globally competitive environment, market financial expectations… • Cost • Business Climate • Less Regulation • Fewer Torts • Round the Clock Operations • Focus on Core Competencies
U.S. IT Workers $70-$100 per hour U.S. Programmers $1,600-$3,600 per mo. U.S. Project Managers $3,600-$7,100 per mo. U.S. Architects $65 per hour U.S. Engineers $90,000 per year IT Workers in India $20 per hour Programmers in the Philippines $250-$700 per mo. Project Managers in the Philippines $700-$1,150 per mo. Architects in Hungary $18 per hour Engineers in the Philippines $13,000 per year Media-reported Salary Comparisons Here…AND…There