Download
1 / 48
490 likes | 1.48k Views
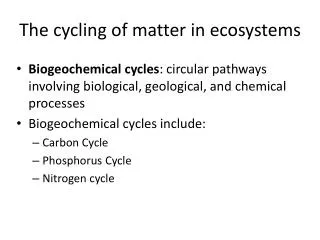
Nutrient Cycling 1: The nitrogen cycle. I. Introduction Changes to the global N cycle (Ch. 15) Global pools and fluxes Changes Consequences Overview of the ecosystem N cycle (Ch. 9) Major pools and fluxes Main points II. Controls on N cycle fluxes in soils (Ch. 9) A. Inputs

E N D
Nutrient Cycling 1: The nitrogen cycle I. Introduction Changes to the global N cycle (Ch. 15) Global pools and fluxes Changes Consequences Overview of the ecosystem N cycle (Ch. 9) Major pools and fluxes Main points II. Controls on N cycle fluxes in soils (Ch. 9) A. Inputs 1. N fixation 2. N deposition B. Internal cycling 1. Mineralization/immobilization 2. Nitrification C. Outputs 1. Gaseous losses (esp. denitrification) 2. Leaching III. Plant uptake and loss (Ch. 8) Powerpoint modified from Harte & Hungate (http://www2.for.nau.edu/courses/hart/for479/notes.htm) and Chapin (http://www.faculty.uaf.edu/fffsc/)
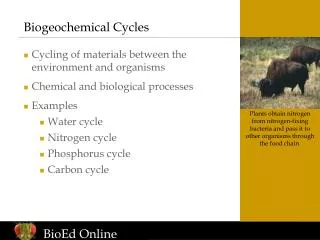
I. Intro to the Nitrogen Cycle Productivity of many ecosystems (managed & unmanaged) is limited by nitrogen availability: terrestrial – temperate, boreal, arctic aquatic – open oceans
Global Pools: • - most in the atmosphere, but not biologically available • - reactive N in atmosphere: trace gases • - lots in sediments and rocks, but not available • - inorganic N in ocean is next largest • - organic pools in plants and soils follow that 15.4 Pools in Tg = 1012 g Fluxes in Tg yr-1
Fluxes: several important biosphere-atmosphere N exchanges - biological: fixation, denitrification, nitrification - abiotic: industrial fixation, lightning fixation, fossil fuel and biomass burning, deposition 15.4 Pools in Tg Fluxes in Tg yr-1
Biological cycling within systems greatly outweighs inputs/outputs (i.e., N cycle is much more “closed” than the C cycle) 15.4 Pools in Tg Fluxes in Tg yr-1
B. Human-mediated fluxes in the global N cycle now exceed‘natural’ (pre-industrial) fluxes 15.5
How much N is added in agriculture? Cotton 56-78 Kg/ha • Iowa corn 170-225 Kg/ha • Taiwan rice: 270 Kg/ha
C. Consequences • Eutrophication • Species changes/losses • Atmospherically active trace gases
Consequences • Eutrophication • Species changes/losses • Atmospherically active trace gases N fert increasing prod. N fert increasing dominance, decreasing diversity Tilman 1987
Consequences • Eutrophication • Species changes/losses • Atmospherically active trace gases • NO + NO2 (NOx): fossil fuel combustion • NO (highly reactive) smog, tropospheric O3 formation • Acid rain (NO2 + OH- HNO3) • N2O: increased fertilizer application denitrification • Potent greenhouse gas (200x more effective than CO2, 6% of total forcing) • Chemically inert in troposphere, but catalyzes destruction of O3 in stratosphere • NH3 15.3
Consequences • Eutrophication • Species changes/losses • Atmospherically active trace gases • NH3: domestic animals, ag fields (fert), biomass burning • Atmospherically active aerosols, air pollution • Deposition, N availability downwind 15.4
Consequences • N deposition increased growth (C sequestration)…to a point. • N saturation: availability exceeds demand • Associated with decreases in forest productivity, potentially due to indirect effects such as acidification, altered plant cold tolerance • N saturation N losses “opening” of the N cycle
B. Overview of Ecosystem N cycle (Ch. 9) • Major pools & fluxes • Main Points • Inputs~outputs • Open (C) vs. closed (N) • Plant needs met by internal recycling • Available soil pools are small relative to organic pools. • Microbes rule bg 9.2
II. Controls on N cycle fluxes in soilA. N Inputs 1. Biological N fixation 2. Atmospheric N deposition 3. Mineral weathering?
1. Biological N Fixation a. What is it? • Conversion of atmospheric N2 to NH4+ (actually, amino acids) • Under natural conditions, nitrogen fixation is the main pathway by which new, available nitrogen enters terrestrial ecosystems
Nitrogen fixation b. Who does it? • Carried out by bacteria • Symbiotic N fixation (e.g., legumes, alder) • Heterotrophic N fixation (rhizosphere and other carbon-rich environments) • Phototrophs (bluegreen algae) • The characteristics of nitrogenase, the enzyme that catalyzes the reduction of N2 to NH4+, dictate much of the biology of nitrogen fixation • High-energy requirement (N triple bond) • Requires abundant energy and P for ATP • Inhibited by O2 • Requires cofactors (e.g., Mo, Fe, S)
Types of N-fixers • There’s no such thing as a N-fixing plant • Symbiotic N-fixers • High rates of fixation (5-20+ g-N m-2 y-1) with plants supplying the C (and the plant receiving N) • Protection from O2 via leghemoglobin (legumes) • Microbial symbiont resides in root nodules • Bacteria (Rhizobia) – Legumes (Lupinus, Robinia) • Actinomycetes (Frankia) - Alnus, Ceanothus (woody non-legumes) • N-fixation rates reduced in presence of high N availability in the soil
Types of N fixers • Associative N fixers • Occur in rhizosphere of plants (non-nodulated); moderate rates with C supply from plant root turnover and exudates (1-5 g-N m-2 y-1) • Reduced [O2] by rapid respiration from plant roots • Azotobacter, Bacillus
Types of N fixers • Free-living N fixers • Heterotrophic bacteria that get organic C from environment and where N is limiting (e.g., decaying logs) • Rates low due to low C supply and lack of O2 protection (0.1-0.5 g-N m-2 y-1) • Also, cyanobacteria (free-living photo-autotrophs); symbiotic lichens (cyanobacteria with fungi offering physical protection)
C. When/where does it happen?N-fixing species are common in early succession • Lichens early in primary succession following deglaciation in Alaska. • Alder at later stages. Photo: D. Hooper
Red alder in secondary succession following clearcutting near Lake Whatcom Photo: D. Hooper
Alder and the other woody hosts of Frankia are typical pioneer species that invade nutrient-poor soils. These plants probably benefit from the nitrogen-fixing association, while supplying the bacterial symbiont with photosynthetic products.
d. Paradox of N limitation • Nitrogen is the element that most frequently limits terrestrial NPP • N2 is the most abundant component of the atmosphere • Why doesn’t nitrogen fixation occur almost everywhere? • Why don’t N fixers have competitive advantage until N becomes non-limiting?
Environmental limitations to N fixation • Energy availability in closed-canopy ecosystems • N-fixers seldom light-limited in well-mixed aquatic ecosystems (e.g., lakes) • Nutrient limitation (e.g., P, Mo, Fe, S) • These elements may be the ultimate controls over N supply and NPP • Grazing • N fixers often preferred forage
Inputs2. Nitrogen Deposition • Wet deposition: dissolved in precipitation • Dry deposition: dust or aerosols by sedimentation (vertical) or impaction (horizontal) • Cloud water: water droplets to plant surfaces immersed in fog; only important in coastal and mountainous areas
Wet deposition typically scales with precipitation. Dry deposition can be significant even in humid climates. Dry deposition a greater proportion of total deposition in more arid climates (Pawnee, CO) Adirondacks Appalachians
N species in deposition depends on type of source http://pah.cert.ucr.edu/aqm/ndep/results.shtml
3. Rock weathering as a source of N? • Some sedimentary rocks contain substantial amounts of N with high rates of N release (up to 2 g-N m-2 y-1); however, most rocks contain little N.
B. Internal Cycling of Nitrogen • In natural ecosystems, most N taken up by plants becomes available through decomposition of organic matter • Over 90% of soil nitrogen is organically bound in detritus in a form unavailable to organisms • The soil microflora secrete extracellular enzymes (exoenzymes) such as proteases, ribonucleases, and chitinases to break down large polymers into water-soluble units such as amino acids and nucleotides that can be absorbed
Internal Cycling of Nitrogen • The pools • Plant biomass • SOM (solid; including litter) • Microbial biomass • DON (a variable portion “plant available”) • NH4+ (plant available) • NO3- (plant available) • The processes: • (Gross) N mineralization • (Gross) N immobilization • (Gross) autotrophic nitrification • N uptake (and assimilation) by plants 9.2
Net Ain’t Gross • Net rates of N transformations (mineralization and nitrification) Net N mineralization = (NH4+ +NO3- pools) = gross N mineralization-gross N immobilization
Net Ain’t Gross • Similarly… Net nitrification = NO3- pool = gross nitrification – gross NO3- immobilization
1. Mineralization/immobilization • Mineralization is closely linked to decomposition. • Plant functional types: effects via litter quality influence on both breakdown of plant material and immob by microbes. • Climate affects mineralization via decomposition (microbial activity). • Species effects can be much greater than differences in climate. 9.3
Critical litter C:N for net N min. (box 9.1) • Microbial C:N ~10:1 • Microbial growth efficiency ~40% • So, for 100 units C, 40 units mic biomass, 60 units respired. • For mic C:N of 10:1, need 4 units of N per 40 units C. • So substrate needs C:N of 100:4 (i.e., 25:1) for net N mineralization.
2. Nitrificationa. Why is Nitrification Important? • Nitrate is more mobile than ammonium, so more readily leached from soil • Substrate for denitrification (N loss as a gas) • Generates acidity if nitrate is lost from soil • Loss of nitrate results in loss of base cations
2.b. Controls on Nitrification • NH4+ + 2O2 NO3- +2H+ + H2O • Two-step process conducted by chemoautotrophic bacteria: • First step conducted by Nitrosomonas (other Nitroso-), NH4+ NO2- , ammonia mono-oxygenase, need O2 • Second step conducted by Nitrobacter, NO2- NO3- • Controls: • NH4+ • O2 • Slow growth of nitrifiers
Nearly all nitrogen that is mineralized in these systems is nitrified on a net basis. • In contrast, net nitrification is frequently less than 25% of net mineralization in temperate coniferous forests. • - Semi-arid forests tend to show more net nitrification relative to net N mineralization 9.6 - The relationship between net nitrogen mineralization and net nitrification (g nitrogen g-1 of dry soil for a 10-day incubation) across a range of tropical forest ecosystems (Vitousek and Matson 1984).
- Substrate limitation is common. - Nitrifiers are obligate aerobes. 9.5
C. N outputs 1. Gaseous losses • Ammonia gas (pK = 8.2, NH4+ NH3 + H+) • Fire • Oxides of N (NO, N2O, N2) • NO and N2O from autotrophic nitrification • NO, N2O, N2from denitrification • Most denitrification conducted by heterotrophic bacteria (many are facultative anaerobes that use NO3- as a terminal e- acceptor in the absence of O2) • Controls: NO3-, C availability, O2,
Nitrification and denitrification occur under different conditions. • Gaseous losses for both follow the “hole-in-the-pipe” model. • H-in-the-P depends on rate of flux and percent of losses. 9.4
High nitrate concentration, much labile C, and lack of oxygen together lead to high denit. rates. 9.7
http://en.wikipedia.org/wiki/Image:Riparian_zone_florida_everglades.gifhttp://en.wikipedia.org/wiki/Image:Riparian_zone_florida_everglades.gif http://www.wldelft.nl/cons/area/mse/ecom/im/wetland-1.jpg Denitrification – where? • Very important in wetlands, riparian areas. • Spatially very patchy in well-drained soils.
C. N outputs2. Leaching • Erosional losses • Solution losses • NO3- >> DON >NH4+ • Greatest when water flux is high and biological demand for N is low (e.g., after snowmelt!)
- Leaching losses of nitrate and cations decrease with forest regrowth at Hubbard Brook. - Plant and microbial demand 9.8
Leaching increases when plant and microbial demand are exceeded (e.g., N saturation). Fig. 9.9
Consequences of Mississippi River N runoff:The Gulf of Mexico “Dead Zone”
Summary: small big • Controls on mineralization (C quality, AET) are similar to those for decomposition, and this is the major source of plant nutrients for natural ecosystems. • Humans are influencing N inputs to ecosystems: N fixation, N deposition. • Higher N availability greater plant growth, until demand saturates. • Microbes compete with plants for available N. • Presence of substrate (NH4+) is a major controller of nitrification; nitrate is much more susceptible to loss than ammonium. • Losses of N cause • Nitrate and nitrite pollution in groundwater (toxicity) • Chemically active N species (NOx) in atmosphere • Radiatively active N species (N2O) in atmosphere • Increased output to aquatic ecosystems (eutrophication). 9.2