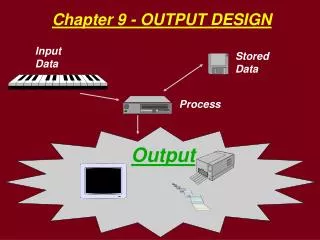
Chapter 9 - OUTPUT DESIGN
Chapter 9 - OUTPUT DESIGN. Input Data. Stored Data. Process. Output. OUTPUT DESIGN. What factors contribute to high quality, useable information?. Accessibility - how easy is it to use? Timeliness - is it available in time? Relevance - is it helpful? Accuracy - is it error-free?

Chapter 9 - OUTPUT DESIGN
E N D
Presentation Transcript
Chapter 9 - OUTPUT DESIGN Input Data Stored Data Process Output
OUTPUT DESIGN What factors contribute to high quality, useable information? • Accessibility - how easy is it to use? • Timeliness - is it available in time? • Relevance - is it helpful? • Accuracy - is it error-free? • Useability - is it in an acceptable format?
OUTPUT DESIGN REPORT CLASSIFICATIONS • Internal • External • Turnaround
September 5, 1998 Student and Course Report Page 1 of 348 Fall Semester 1998 Last, First Name Student ID Course ID Units Section 3 3 3 3 3 15 3 3 3 3 1 13 3 3 3 3 3 3 18 2 1 1 1 3 1 2 2 1 5 1 2 1 2 1 1 Adams, Mary Aherns, Madhi Banks, Jamal Bio101 Eng100 Soc105 Phl108 Eco104 Total Act102 Bio101 Chm109 Phl108 PEd118 Total Chm109 Eco104 Eng100 MIS111 Mkt114 Soc105 Total 387-33-8610 559-68-0348 371-49-3256 September 5, 1998 Course Summary Report Page 1 of 28 Fall Semester 1998 Total Total Avg. Course ID Course Name Units Sects Enroll Enroll/Sect Internal Report Samples 75 ... ... 100 ... ... 45 ... ... 30 .. .. 26 ... ... 110 300 ... ... 600 ... ... 90 ... ... 60 .. .. 208 ... ... 330 Act102 ... ... Bio101 ... ... Chm109 ... ... Eco104 ... ... Eng100 ... ... MIS111 Accounting Prin. ... ... Intro to Biology ... ... Organic Chem. ... ... Macro Economics ... ... Begin. English ... ... Intro to Computers 4 .. .. 6 .. .. 2 .. .. 2 .. .. 8 .. .. 3 3 ... ... 3 ... ... 3 ... ... 3 ... ... 3 ... ... 3 vvvvwvvvvvvvvvvvvvvvvvvvvvvvvvvvvvvvvvvvvvvvvvvvvvvvvvvv
Order Number Order Date ABC Incorporated SALES ORDER FORM Customer Number Customer Name Street Address City State Zip Code Product Product Unit Total Number Name Color Price Quantity Price 1 2 3 4 5 6 7 ORDER TOTAL SALES TAX SHIPPING GRAND TOTAL Come to ABC Incorporated for all your technology needs. Thank you for your patronage. You are a valued customer. External Report Sample
Turnaround Reports [Documents] XYZ Corporation John Smith #JS123 123.00 443.44 blah, blah, blah,..... Tear off this portion and mail it in with your payment. John Smith #JS123; amout $____
OUTPUT DESIGN OUTPUT DEVICES OUTPUT MEDIA • Printers • Video Display Unit • Plotters • COM Equipment • Speakers • Paper • Video Screen • Microfilm/Microfiche • Air Waves/Sound
OUTPUT DESIGN OUTPUT FORMATS • ZONED - (row & column) • GRAPHIC - (images) • NARRATIVE - (text)
September 5, 1998 Student and Course Report Page 1 of 348 Fall Semester 1998 Last, First Name Student ID Course ID Units Section a) z o n e d Adams, Mary Aherns, Madhi , Jamal 3 3 3 3 3 15 3 3 ... 2 1 1 1 3 1 2 ... Bio101 Eng100 Soc105 Phl108 Eco104 Total Act102 Bio101 ….. 387-33-8610 559-68-0348 vvvvvvvvvvvvvvvvvvvvvvvvvvvvvvvvvvvvvvvvvvvvvvvvvvvvvvvvvvvvvvv b) g r a p h i c Output formats. Today's information systems present information in three basic formats--zoned, graphic, and narrative as illustrated in Figure 9.3. Format refers to the look of the output on the media, hence sound is not included here. Zoned output is the traditional row and column oriented textual and numeric information. Graphic output... c) narrative Output Format Examples
OUTPUT DESIGN REPORT TYPES • DETAIL • SUMMARY • ANALYTICAL • HISTORICAL
Detail Report September 5, 1998 Student and Course Report Page 1 of 348 Fall Semester 1998 Last, First Name Student ID Course ID Units Section 3 3 3 3 3 15 3 3 3 3 1 13 3 3 3 3 3 3 18 2 1 1 1 3 1 2 2 1 5 1 2 1 2 1 1 Adams, Mary Aherns, Madhi Banks, Jamal Bio101 Eng100 Soc105 Phl108 Eco104 Total Act102 Bio101 Chm109 Phl108 PEd118 Total Chm109 Eco104 Eng100 MIS111 Mkt114 Soc105 Total 387-33-8610 559-68-0348 371-49-3256 vvvvvvvvvvvvvvvvvvvvvvvvvvvvvvvvvvvvvvvvvvvvvvvvvvvvvvvvvvvvvvvvvvvvvvvvvvvvvvvv
Summary Report September 5, 1998 Course Summary Report Page 1 of 28 Fall Semester 1998 Total Total Avg. Course ID Course Name Units Sects Enroll Enroll/Sect 75 ... ... 100 ... ... 45 ... ... 30 .. .. 26 ... ... 110 ... ... 55 ... ... 12 300 ... ... 600 ... ... 90 ... ... 60 .. .. 208 ... ... 330 ... ... 110 ... ... 84 Act102 ... ... Bio101 ... ... Chm109 ... ... Eco104 ... ... Eng100 ... ... MIS111 ... ... Mkt114 ... ... PEd118 Accounting Prin. ... ... Intro to Biology ... ... Organic Chem. ... ... Macro Economics ... ... Begin. English ... ... Intro to Computers ... ... Prin. of Marketing ... ... Begin. Golf 4 .. .. 6 .. .. 2 .. .. 2 .. .. 8 .. .. 3 .. .. 2 .. .. 7 3 ... ... 3 ... ... 3 ... ... 3 ... ... 3 ... ... 3 ... ... 3 ... ... 1 vvvvvvvvvvvvvvvvvvvvvvvvvvvvvvvvvvvvvvvvvvvvvvvvvvvvvvvvvvvvvvvvvvvvvvvvvvvvvvvvv
Horizontal Analytical Report Data Based Decisions, Inc. Comparative Balance Sheet - Horizontal Analysis For Fiscal Years 1996 and 1997 - values in millions 1/27/98 1996 1997 Amount Percent Difference Difference Assets Cash Accounts Receivable Office Equipment Total Assets Liabilities Accounts Payable Long-Term Debt Total Liabilities Capital Common Stock Retained Earnings Total Capital Total Liabilities & Capital 0.8 3.7 5.5 10.0 1.2 2.8 4.0 3.0 3.0 6.0 10.0 $ 0.6 3.3 5.2 9.1 1.1 3.2 4.3 3.0 1.8 4.8 9.1 $ $ 0.2 0.4 0.3 0.9 0.1 (0.4) (0.3) 0.0 1.2 1.2 0.9 33.0 % 12.1 5.8 9.9 9.1 (12.5) 7.0 0.0 66.7 25.0 9.9
Vertical Analytical Report Data Based Decisions, Inc. Comparative Income Statement - Vertical Analysis For Fiscal Years 1996 and 1997 - values in millions 1/27/98 -----------1996-------- ----------1997----------- Amount Percent Amount Percent Income: Hardware Sales Software Sales Supplies Sales Consulting Services Total Income Expenses: Advertising Office Salaries Hardware Software Supplies Total Expenses Net Income before taxes Income Taxes Net Income $ 1.6 1.2 0.2 4.4 7.4 0.2 0.3 3.3 0.9 0.7 0.1 5.5 1.9 0.8 1.1 $ 1.9 1.7 0.3 5.2 9.1 0.3 0.4 3.9 1.1 1.2 0.2 7.1 2.0 0.9 1.1 20.9 18.7 3.3 57.1 100.0 3.3 4.4 42.9 12.1 13.2 2.2 78.1 21.9 9.9 12.0 21.6 16.2 2.7 59.5 100.0 2.7 4.1 44.6 12.2 9.5 1.4 74.5 25.5 10.8 14.7
Counterbalance Analytical Report Data Based Decisions, Inc. North Island Networking Project Analysis Project Start Date: 10/1/98 - ($000 omitted) 8/12/98 Worst Case Moderate Case Best Case Income: Hardware Sales Software Sales Supplies Sales Consulting Services Total Income Expenses: Project Overhead Salaries Hardware Software Supplies Total Expenses Net Income on the project 800 300 050 150 1,300 200 140 750 200 40 1,330 (30) $ $ 850 350 050 190 1,440 200 150 650 160 40 1,200 240 $ 800 300 050 175 1,325 200 140 700 180 40 1,260 65
Variance Analytical Report Student Personal Monthly Budget Variance Analysis Month: October 1997 11/9/97 Budget Actual Variance Income Expenses Rent Telephone Car Payment Insurance Food/Drink Clothes School Supplies Savings Utilities Gifts Discretionary Total Expenses Balance Remaining (2.9%) (20%) (7.4%) 24% 68% (12%) (40%) (10%) (0.4%) $ 700 150 20 100 70 135 50 25 50 25 25 50 700 0 (20) (4) (10) 12 17 (3) (10) (5) (3) (23) $ 680 150 24 100 70 145 38 8 50 28 35 55 703 (23) $
Exception Analytical Report San Diego Weather Exception Report For Calendar Year 1997 Lower Limit: 45 degrees; Upper Limit: 85 degrees 1/9/98 Date Time of Day Temperature 04:15am 04:12am 04:11am 03:50am 03:40am 02:57am 02:45pm 02:38pm 02:30pm etc... 42 41 41 39 40 44 89 94 95 etc... 01/11/97 01/12/97 01/13/97 02/08/97 02/26/97 03/14/97 07/19/97 07/20/97 07/21/97 etc... vvvvvvvvvvvvvvvvvvvvvvvvvvvvvvvvvvvvvvvvvvvvvvvvvvvvvvvvvvvvvvvvvvvvvvv
OUTPUT DESIGN OUTPUT GRAPHS • SCATTER DIAGRAM • LINE DIAGRAM • BAR CHART - horizontal & vertical • SECTOGRAPH - pie & layer
data sets: C D B A X Y X Y X Y X Y 9 14 12 15 6 11 16 10 7 14 17 19 12 18 14 20 13 15 11 16 8 6 13 7 11 5 12 10 14 9 8 9 8 8 8 9 3 6 7 9 8 10 9 13 14 11 4 6 7 12 6 13 11 15 2 10 17 8 5 14 5 7 13 10 3 6 11 14 17 12 10 8 17 13 4 5 9 11 19 15 Scatter Diagrams Y C 20 15 10 5 . . . . . . . . . . X 0 5 10 15 20 Y Y Y B D A 20 15 10 5 20 15 10 5 20 15 10 5 . . . . . . . . . . . . . . . . . . . . . . . . . . . . . . X X X 0 5 10 15 20 0 5 10 15 20 0 5 10 15 20
Line Diagram Computers Unlimited, Inc. Sales of Hardware and Software For Year 1997 in Dollars 200 175 150 125 100 75 50 25 0 Hardware Software Jan Feb Mar Apr May Jun Jul Aug Sep Oct Nov Dec
Horizontal Bar Chart California State University, Pasadena College of Business Administration Enrollment by Major - Fall 1997 Accounting Finance Information Systems Management Marketing 0 10 20 30 40 50 60 70 80 90 100
Vertical Bar Chart California State University, Pasadena College of Business Administration Total Enrollment by Semester 500 450 400 350 300 250 200 Fall Spring Fall Spring Fall Spring Fall Spring ‘94 ‘95 ‘95 ‘96 ‘96 ‘97 ‘97 ‘98
Pie Chart California State University, Pasadena College of Business Administration Enrollment by Major - Fall 1997 Marketing 16% Accounting 24% Management 20% Finance 22% Information Systems 18%
Layer Graph California State University, Pasadena College of Business Administration Total Enrollment by Semester 350 300 250 200 150 100 50 Marketing Management Information Systems Finance Accounting Spring Fall Spring Fall Spring ‘96 ‘96 ‘97 ‘97 ‘98
3 Dimensional (3D) Horizontal Bar Chart California State University, Pasadena College of Business Administration Enrollment by Major - Fall 1997
OUTPUT DESIGN INTERNAL CONTROLS FOR OUTPUT • TIMING • VOLUME • DISTRIBUTION • ACCESS SECURITY
OUTPUT DESIGN THE FUTURE ?