Download

1 / 10
0 likes | 5 Views
Annual reports in 2025 go beyond compliance to become powerful storytelling tools. Trends like bold visuals, data-driven storytelling, interactive digital formats, and sustainable design are driving deeper engagement and stronger stakeholder connections.

E N D
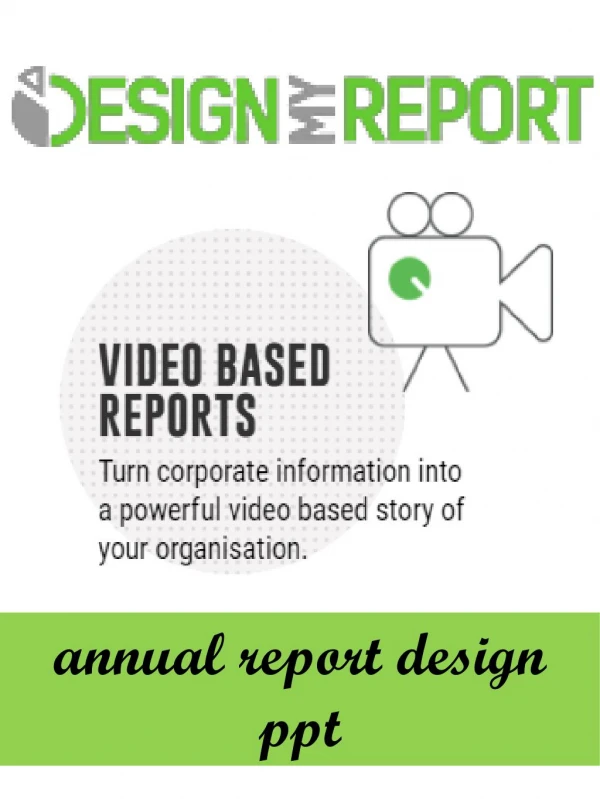
2025 Annual Report Design Trends That Drive Engagement The landscape of corporate communication is evolving rapidly, and annual reports are no exception. As we navigate through 2025, forward-thinking companies are reimagining how they present their yearly achievements, challenges, and vision to stakeholders. Professional annual report design servicesare embracing innovative approaches that transform traditional static documents into engaging, interactive experiences.
Interactive Digital-First Experiences Traditional reports are giving way to dynamic digital platforms • Multimedia Integration: Modern annual reports incorporate video testimonials, animated infographics, and interactive charts that allow users to explore data at their own pace • Clickable Navigation: Intuitive menu systems and cross-referencing enable readers to jump between sections seamlessly • Real-time Data Updates: Digital reports can display live performance metrics, making information more current and relevant • Mobile Optimization: With over 60% of corporate stakeholders accessing reports on mobile devices, responsive design has become non-negotiable Why it works: Interactive elements increase reader engagement by 73% compared to static PDF reports, leading to better stakeholder retention and understanding.
Minimalist Aesthetics with Bold Typography Less is more - but with strategic impact Clean White Space: Strategic use of negative space guides the reader's eye and prevents information overload Statement Typography: Large, custom fonts create hierarchy and brand personality while maintaining readability Limited Color Palettes: 2-3 core colors with accent hues create sophisticated, professional appearances Grid-Based Layouts: Structured design systems ensure consistency across all report sections Implementation tip: Annual report design companies are using typography as a primary design element, with fonts becoming brand differentiators rather than mere text carriers.
Data Visualization Revolution Complex information made beautifully simple 3D Charts and Graphs: Dimensional visualizations add depth without compromising clarity Animated Infographics: Motion graphics explain processes and timelines more effectively than static images Custom Icon Systems: Branded iconography creates visual consistency while improving information retention Color-Coded Data Stories: Strategic color application helps readers quickly identify trends and patterns Implementation tip: Annual report design companies are using typography as a primary design element, with fonts becoming brand differentiators rather than mere text carriers.
Sustainability-Focused Visual Storytelling ESG reporting meets compelling design • Earth-Tone Color Schemes: Natural greens, blues, and browns reflect environmental consciousness • Organic Shapes and Patterns: Curved lines and nature-inspired graphics soften corporate messaging • Impact Measurement Graphics: Visual representations of carbon footprint reductions, waste minimization, and social impact metrics • Authentic Photography: Real employees and genuine workplace moments over stock imagery Market reality: 89% of investors now consider ESG factors in their decisions, making sustainability reporting design crucial for stakeholder engagement.
Personalized Stakeholder Experiences One size no longer fits all Audience-Specific Sections: Customized content paths for investors, employees, customers, and regulators Interactive Role Selection: Readers choose their stakeholder category to see relevant information first Localized Content: Regional offices and markets get dedicated sections with local imagery and data Accessibility Features: Screen reader compatibility, high contrast modes, and adjustable text sizes ensure inclusivity Strategic advantage: Personalized annual reports generate 67% higher engagement rates and 34% longer reading times.
Micro-Animations and Subtle Motion Graphics Adding life without distraction Hover Effects: Gentle animations on interactive elements provide user feedback Loading Transitions: Smooth page transitions maintain engagement during content loading Data Reveals: Animated chart building creates anticipation and focuses attention Parallax Scrolling: Layered visual effects add depth to digital browsing experiences
Implementation Strategy for Annual Report Design Services Making trends work for your organization Start Early: Begin design planning 4-5 months before report deadline to allow for trend integration User Testing: Conduct stakeholder feedback sessions on design concepts before final production Cross-Platform Consistency: Ensure design elements work across print, digital, and presentation formatsMeasurement Metrics: Track engagement analytics to measure trend effectiveness
The Future of Annual Report Design Professional annual report design company partnerships are becoming essential as these trends require specialized expertise in both design technology and corporate communication strategy. The most successful 2025 reports will be those that balance innovative design with clear, accessible information delivery. Companies investing in trend-forward annual report design are seeing measurable returns through increased stakeholder engagement, improved brand perception, and more effective corporate communication. As we progress through 2025, these design trends will continue evolving, making professional design partnerships more valuable than ever. The key to successful implementation lies not in adopting every trend, but in selecting those that best serve your company's unique story, audience, and strategic objectives. The annual reports that truly drive engagement are those that thoughtfully integrate these modern design approaches with authentic corporate narratives.
CONTACT PORTFOLIO BLOG HOME ADDRESS AAC-006 2nd Floor Shipra Krishna Azure,Kaushambi, Ghaziabad, Uttar Pradesh 201010 EMAILinfo@designboxindia.com PHONE+91 9910895680 Thank You ©2023 Designbox Studio Pvt. Ltd. All Rights Reserved.