Download
1 / 8
80 likes | 537 Views
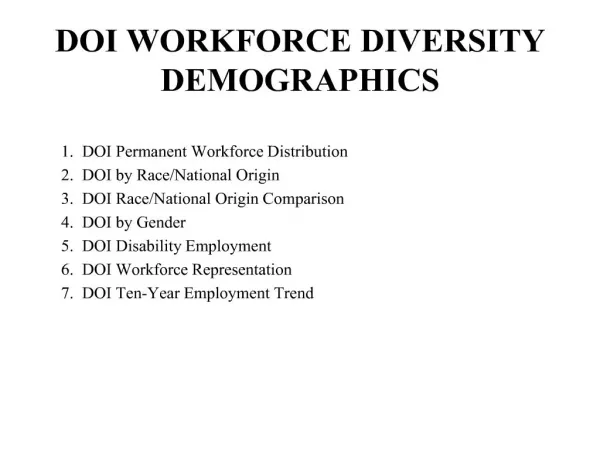
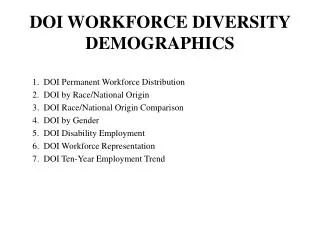
DOI WORKFORCE DIVERSITY DEMOGRAPHICS. 1. DOI Permanent Workforce Distribution 2. DOI by Race/National Origin 3. DOI Race/National Origin Comparison 4. DOI by Gender 5. DOI Disability Employment 6. DOI Workforce Representation 7. DOI Ten-Year Employment Trend.

E N D
DOI WORKFORCE DIVERSITY DEMOGRAPHICS 1. DOI Permanent Workforce Distribution 2. DOI by Race/National Origin 3. DOI Race/National Origin Comparison 4. DOI by Gender 5. DOI Disability Employment 6. DOI Workforce Representation 7. DOI Ten-Year Employment Trend
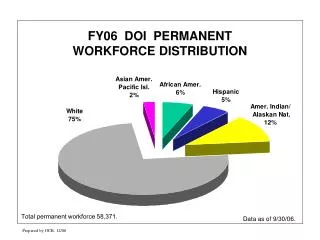
DOI PERMANENT WORKFORCE DISTRIBUTION Data as of 9/30/02 Prepared by OEO, 10/02
FY02 DOI Race/National Origin ACTUAL Onboard as of 9/30/02 Total 2,058 10,082 6,324 5,550 8,777 17,001 8,559 361 611 1,703 258 Prepared by OEO, 10/02
FY02 DOI RACE/NATIONAL ORIGIN In Comparison to Federal Workforce & Civilian Labor Force Asian Amer./ Pacific Islanders African Americans Hispanics Amer. Indian/ Alaska Natives Women Permanent Federal Workforce* 66,474 268,637 101,973 30,292 667,440 Federal Workforce* 4.4% 17.7% 6.7% 2.0% 44.0% Civilian Labor Force* 3.9% 11.3% 11.9% 0.9% 46.5% Department of the Interior FY01 1.9% 6.3% 5.0% 12.2% 38.2% Department of the Interior FY02 1.9% 6.1% 4.9% 12.2% 38.3% *Data obtained from OPM FY2001 Annual Report to Congress of non-postal Federal executive branches with 500 or more permanent employees. Department of the Interior FY01 statistics as of 9/30/01 and FY02 statistics as of 9/30/02. Prepared by OEO, 10/02
FY02 DOI Gender by Bureau/Office % Data as of 9/30/02. Prepared by OEO, 10/02
FY02 DOI Employees with Disability Permanent and Temporary Actual: 161 662 452 535 740 1,533 632 25 21 93 7 4,861 % From 9/30/01 to 9/30/02 DOI had a net increase of 91 employees with a disability. Actual shows targeted and non-targeted disabilities. Onboard is percent of total DOI employees with a disability. Prepared by OEO, 10/02
FY02 DOI Representation Compared to National Civilian Labor Force % DOI% as of 9/30/02. NCLF% taken from 1990 Census Availability Data and used by EEOC to assess under-representation of minorities and women. Women (Wo) include all RNO. Prepared by OEO, 10/02
DOI Employment TrendFY92 - FY02 Prepared by OEO, 10/02