ML Notes
E N D
Presentation Transcript
DIGITAL NOTES ON Machine Learning (R20D5803) M.Tech., II YEAR –I SEM (2021-2022) DEPARTMENT OF COMPUTER SCIENCE AND ENGINEERING MALLA REDDY COLLEGE OF ENGINEERING & TECHNOLOGY (Autonomous Institution – UGC, Govt. of India) (Affiliated to JNTUH, Hyderabad, Approved by AICTE - Accredited by NBA & NAAC –‘A’ Grade - ISO 9001:2015 Certified) Maisammaguda, Dhulapally (Post Via. Hakimpet), Secunderabad – 500100, Telangana State, INDIA. 1
MALLA REDDY COLLEGE OF ENGINEERING & TECHNOLOGY DEPARTMENT OF COMPUTER SCIENCE AND ENGINEERING SYLLABUS II Year M. Tech. CSE – I Sem L/T/P/ 3 / - / - C 3 (R20D5803) Machine Learning Objectives: 1.This course explains machine learning techniques such as decision tree learning, Bayesian learning etc. 2.To understand computational learning theory. 3.To study the pattern comparison techniques. UNIT - I Introduction Well-posed learning problems, designing a learning system Perspectives and issues in machine learning Concept learning and the general to specific ordering Introduction,A concept learning task, concept learning as search, Find-S: Finding a Maximally Specific Hypothesis, Version Spaces and the Candidate Elimination algorithm, Remarks on Version Spaces and Candidate Elimination, Inductive Bias. Decision Tree Learning-Introduction, Decision Tree Representation, Appropriate Problems for Decision Tree Learning, The Basic Decision Tree Learning Algorithm Hypothesis Space Search in Decision Tree Learning, Inductive Bias in Decision Tree Learning, Issues in Decision Tree Learning. UNIT - II Artificial Neural Networks -Introduction, Neural Network Representation, Appropriate Problems for Neural Network Learning, Perceptions, Multilayer Networks and the Back propagation Algorithm. Discussion on the Back Propagation Algorithm, An illustrative Example: Face Recognition UNIT - III Bayesian learning-Introduction, Byes Theorem, Bayes Theorem and Concept Learning Maximum Likelihood and Least Squared Error Hypotheses, Maximum Likelihood Hypotheses for Predicting Probabilities, Minimum Description Length Principle, Bayes Optimal Classifier, Gibs Algorithm, Naïve Bayes Classifier, An Example: Learning to Classify Text, Bayesian Belief Networks, EM Algorithm. Instance-Based Learning-Introduction, k-Nearest Neighbor Learning, Locally Weighted Regression, Radial Basis Functions, Case-Based Reasoning, Remarks on Lazy and Eager Learning. UNIT -IV Pattern Comparison Techniques-Temporal patterns, Dynamic Time Warping Methods,Clustering, Introduction to clustering, K-means clustering, K-Mode Clustering. Codebook Generation, Vector Quantization. UNIT - V Genetic Algorithms: Different search methods for induction - Explanation-based Learning: using prior knowledge to reduce sample complexity. Dimensionality reduction: feature selection, principal component analysis, linear discriminate analysis, factor analysis, independent component analysis, multidimensional scaling, and manifold learning. 2
Textbooks: 1.Machine Learning – Tom M. Mitchell, -MGH 2.Fundamentals of Speech Recognition By Lawrence Rabiner and Biing – Hwang Juang .Ethem Alpaydin, ”Introduction to Machine Learning”, MIT Press, Prentice Hall of India, 3 rd Edition2014. 3.Mehryar Mohri, Afshin Rostamizadeh, Ameet Talwalkar ” Foundations of Machine Learning”,MIT Press,2012 References: 1.Machine Learning : An Algorithmic Perspective, Stephen Marsland, Taylor & Francis . 3
MALLA REDDY COLLEGE OF ENGINEERING & TECHNOLOGY DEPARTMENT OF COMPUTER SCIENCE AND ENGINEERING INDEX S. No Topic Page no Unit Introduction Well-posed learning problems I 1 1 I A concept learning task, concept learning as search 2 6 I 15 3 Find-S: Finding a Maximally Specific Hypothesis I Version Spaces and the Candidate Elimination algorithm 4 17 I Remarks on Version Spaces and Candidate Elimination, Inductive Bias 5 21 I Decision Tree Learning-Introduction, Decision Tree Representation 6 22 I Appropriate Problems for Decision Tree Learning Decision Tree Learning Algorithm, Issues in Decision Tree Learning. 7 23 I 8 25 S. No Topic Page no Unit Artificial Neural Networks -Introduction, Neural Network Representation Appropriate Problems for Neural Network Learning II 26 1 II 28 2 II Perceptions, Multilayer Networks & the Back propagation Algorithm. 3 29 II 34 4 Discussion on the Back Propagation Algorithm 4
MALLA REDDY COLLEGE OF ENGINEERING & TECHNOLOGY DEPARTMENT OF COMPUTER SCIENCE AND ENGINEERING S. No Topic Page no Unit III Bayesian learning-Introduction ,Bayes Theorem & Concept Learning maximum Maximum Likelihood Hypotheses for Predicting Probabilities(MAP) 1 36 III 2 42 III 3 Gibs Algorithm, Naïve Bayes Classifier 46 III Minimum Description Length Principle , Bayes Optimal Classifier An Example: Learning to Classify Text, Bayesian Belief Networks 4 47 III 5 50 EM Algorithm. Instance-Based Learning-Introduction III 51 6 7 k-Nearest Neighbor Learning, Locally Weighted Regression III 55 8 Radial Basis Functions, Case-Based Reasoning III 56 9 Remarks on Lazy and Eager Learning. III 57 5
MALLA REDDY COLLEGE OF ENGINEERING & TECHNOLOGY DEPARTMENT OF COMPUTER SCIENCE AND ENGINEERING S. No Topic Page no Unit IV 1 Pattern Comparison Techniques-Temporal patterns, 58 IV 2 Dynamic Time Warping Methods 61 IV Clustering 3 67 IV 5 K-means clustering 69 IV K-Mode Clustering. Codebook Generation 6 70 IV 7 Vector Quantization. 76 S. No Topic Page no Unit Genetic Algorithms: Different search methods for induction Explanation-based Learning: using prior knowledge to reduce sample complexity. V 78 1 V 79 2 V Dimensionality reduction 82 3 V 84 4 Principal component analysis V 85 Linear discriminate analysis, factor analysis, 5 Independent component analysis: multidimensional scaling, and manifold learning. V 86 6 6
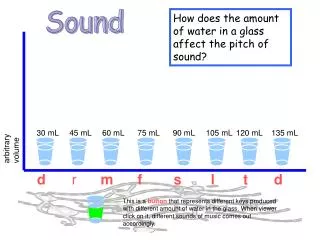
Department of CSE MRCET UNIT-I Machine Learning is the field of study that gives computers the capability to learn without being explicitly programmed. ML is one of the most exciting technologies that one would have ever come across. As it is evident from the name, it gives the computer that makes it more similar to humans: The ability to learn. Machine learning is actively being used today, perhaps in many more places than one would expect. Machine Learning is broadly categorized under the following headings: Machine learning evolved from left to right as shown in the above diagram. •Initially, researchers started out with Supervised Learning. This is the case of housing price prediction discussed earlier . •This was followed by unsupervised learning, where the machine is made to learn on its own without any supervision. •Scientists discovered further that it may be a good idea to reward the machine when it does the job the expected way and there came the Reinforcement Learning. •Very soon, the data that is available these days has become so humongous that the conventional techniques developed so far failed to analyse the big data and provide us the predictions. 1
Department of CSE MRCET •Thus, came the deep learning where the human brain is simulated in the Artificial Neural Networks (ANN) created in our binary computers. •The machine now learns on its own using the high computing power and huge memory resources that are available today. •It is now observed that Deep Learning has solved many of the previously unsolvable problems. •The technique is now further advanced by giving incentives to Deep Learning networks as awards and there finally comes Deep Reinforcement Learning. Let us now study each of these categories in more details Supervised Learning: Supervised learning is analogous to training a child to walk. You will hold the child’s hand, show him how to take his foot forward, walk yourself for a demonstration and so on, until the child learns to walk on his own. Regression: Similarly, in the case of supervised learning, you give concrete known examples to the computer. You say that for given feature value x1 the output is y1, for x2 it is y2, for x3 it is y3, and so on. Based on this data, you let the computer figure out an empirical relationship between x and y. Once the machine is trained in this way with a sufficient number of data points, now you would ask the machine to predict Y for a given X. Assuming that you know the real value of Y for this given X, you will be able to deduce whether the machine’s prediction is correct. Thus, you will test whether the machine has learned by using the known test data. Once you are satisfied that the machine is able to do the predictions with a desired level of accuracy (say 80 to 90%) you can stop further training the machine. Now, you can safely use the machine to do the predictions on unknown data points, or ask the machine to predict Y for a given X for which you do not know the real value of Y. This training comes under the regression that we talked about earlier. 2
Department of CSE MRCET Classification: You may also use machine learning techniques for classification problems. In classification problems, you classify objects of similar nature into a single group. For example, in a set of 100 students say, you may like to group them into three groups based on their heights - short, medium and long. Measuring the height of each student, you will place them in a proper group. Now, when a new student comes in, you will put him in an appropriate group by measuring his height. By following the principles in regression training, you will train the machine to classify a student based on his feature – the height. When the machine learns how the groups are formed, it will be able to classify any unknown new student correctly. Once again, you would use the test data to verify that the machine has learned your technique of classification before putting the developed model in production. Supervised Learning is where the AI really began its journey. This technique was applied successfully in several cases. You have used this model while doing the hand-written recognition on your machine. Several algorithms have been developed for supervised learning. You will learn about them in the following chapters. Unsupervised Learning: In unsupervised learning, we do not specify a target variable to the machine, rather we ask machine “What can you tell me about X?”. More specifically, we may ask questions such as given a huge data set X, “What are the five best groups we can make out of X?” or “What features occur together most frequently in X?”. To arrive at the answers to such questions, you can understand that the number of data points that the machine would require to deduce a strategy would be very large. In case of supervised learning, the machine can be trained with even about few thousands of data points. However, in case of unsupervised learning, the number of data points that is reasonably accepted for learning starts in a few millions. These days, the data is generally abundantly available. The data ideally requires curating. However, the amount of data that is continuously flowing in a social area network, in most cases data curation is an impossible task. The following figure shows the boundary between the yellow and red dots as determined by unsupervised machine learning. You can see it clearly that the machine 3
Department of CSE MRCET would be able to determine the class of each of the black dots with a fairly good accuracy. Reinforcement Learning: Consider training a pet dog, we train our pet to bring a ball to us. We throw the ball at a certain distance and ask the dog to fetch it back to us. Every time the dog does this right, we reward the dog. Slowly, the dog learns that doing the job rightly gives him a reward and then the dog starts doing the job right way every time in future. Exactly, this concept is applied in “Reinforcement” type of learning. The technique was initially developed for machines to play games. The machine is given an algorithm to analyse all possible moves at each stage of the game. The machine may select one of the moves at random. If the move is right, the machine is rewarded, otherwise it may be penalized. Slowly, the machine will start differentiating between right and wrong moves and after several iterations would learn to solve the game puzzle with a better accuracy. The accuracy of winning the game would improve as the machine plays more and more games. The entire process may be depicted in the following diagram: 4
Department of CSE MRCET Deep Learning: The deep learning is a model based on Artificial Neural Networks (ANN), more specifically Convolutional Neural Networks (CNN)s. There are several architectures used in deep learning such as deep neural networks, deep belief networks, recurrent neural networks, and convolutional neural networks. These networks have been successfully applied in solving the problems of computer vision, speech recognition, natural language processing, bioinformatics, drug design, medical image analysis, and games. There are several other fields in which deep learning is proactively applied. The deep learning requires huge processing power and humongous data, which is generally easily available these days. We will talk about deep learning more in detail in the coming chapters. Deep Reinforcement Learning: The Deep Reinforcement Learning (DRL) combines the techniques of both deep and reinforcement learning. The reinforcement learning algorithms like Q learning are now combined with deep learning to create a powerful DRL model. The technique has been with a great success in the fields of robotics, video games, finance and healthcare. Many previously unsolvable problems are now solved by creating DRL models. There is lots of research going on in this area and this is very actively pursued by the industries. So far, you 5
Department of CSE MRCET have got a brief introduction to various machine learning models, now let us explore slightly deeper into various algorithms that are available under these models. Well posed learning problems: A computer program is said to learn from experience E in context to some task T and some performance measure P, if its performance on T, as was measured by P, upgrades with experience E. Any problem can be segregated as well-posed learning problem if it has three traits – •Task •Performance Measure •Experience Certain example that efficiently defines the well-posed learning problems are: 1.To better filter emails as spam or not •Task – Classifying emails as spam or not •Performance Measure – The fraction of emails accurately classified as spam or not spam •Experience – Observing you label emails as spam or not spam 2.A checkers learning problem •Task – Playing checkers game •Performance Measure – percent of games won against opposer •Experience –playing implementation games against itself 3.Handwriting Recognition Problem •Task – Acknowledging handwritten words within portrayal •Performance Measure – percent of words accurately classified •Experience – a directory of handwritten words with given classifications 4.A Robot Driving Problem •Task – driving on public four-lane highways using sight scanners •Performance Measure – average distance progressed before a fallacy •Experience – order of images and steering instructions noted down while observing a human driver 5.Fruit Prediction Problem 6
Department of CSE MRCET •Task – forecasting different fruits for recognition •Performance Measure – able to predict maximum variety of fruits •Experience – training machine with the largest datasets of fruits images 6.Face Recognition Problem •Task – predicting different types of faces •Performance Measure – able to predict maximum types of faces •Experience – training machine with maximum amount of datasets of different face images 7.Automatic Translation of documents •Task – translating one type of language used in a document to other language •Performance Measure – able to convert one language to other efficiently •Experience – training machine with a large dataset of different types of languages Design of a learning system: Just now we looked into the learning process and also understood the goal of the learning. When we want to design a learning system that follows the learning process, we need to consider a few design choices. The design choices will be to decide the following key components: Type of training experience Choosing the Target Function Choosing a representation for the Target Function Choosing an approximation algorithm for the Target Function The final Design We will look into the game - checkers learning problem and apply the above design choices. For a checkers learning problem, the three elements will be, •Task T: To play checkers •Performance measure P: Total present of the game won in the tournament. •Training experience E: A set of games played against itself. 1. 2. 3. 4. 5. Type of training experience: During the design of the checker's learning system, the type of training experience available for a learning system will have a significant effect on the success or failure of the learning. 7
Department of CSE MRCET Direct or Indirect training experience: In the case of direct training experience, an individual board states and correct move for each board state are given. In case of indirect training experience, the move sequences for a game and the final result (win, lose or draw) are given for a number of games. How to assign credit or blame to individual moves is the credit assignment problem. 1.Teacher or Not: Supervised: The training experience will be labelled, which means, all the board states will be labelled with the correct move. So the learning takes place in the presence of a supervisor or a teacher. Un-Supervised: The training experience will be unlabelled, which means, all the board states will not have the moves. So the learner generates random games and plays against itself with no supervision or teacher involvement. Semi-supervised: Learner generates game states and asks the teacher for help in finding the correct move if the board state is confusing. 2.Is the training experience good: Do the training examples represent the distribution of examples over which the final system performance will be measured? Performance is best when training examples and test examples are from the same/a similar distribution. The checker player learns by playing against oneself. Its experience is indirect. It may not encounter moves that are common in human expert play. Once the proper training experience is available, the next design step will be choosing the Target Function. Choosing the Target Function: When you are playing the checkers game, at any moment of time, you make a decision on choosing the best move from different possibilities. You think and apply the learning that you have gained from the experience. Here the learning is, for a specific board, you move a checker such that your board 8
Department of CSE MRCET state tends towards the winning situation. Now the same learning has to be defined in terms of the target function. Here there are 2 considerations — direct and indirect experience. •During the direct experience the checkers learning system, it needs only to learn how to choose the best move among some large search space. We need to find a target function that will help us choose the best move among alternatives. Let us call this function Choose Move and use the notation Choose Move: B →M to indicate that this function accepts as input any board from the set of legal board states B and produces as output some move from the set of legal moves M. •When there is an indirect experience it becomes difficult to learn such function. How about assigning a real score to the board state. So the function be V: B →R indicating that this accepts as input any board from the set of legal board states B and produces an output a real score. This function assigns the higher scores to better board states If the system can successfully learn such a target function V, then it can easily use it to select the best move from any board position. Let us therefore define the target value V(b) for an arbitrary board state b in B, as follows: 9
Department of CSE MRCET 1.if b is a final board state that is won, then V(b) = 100 2.if b is a final board state that is lost, then V(b) = -100 3.if b is a final board state that is drawn, then V(b) = 0 4.if b is a not a final state in the game, then V (b) = V (b’), where b’ is the best final board state that can be achieved starting from b and playing optimally until the end of the game. The (4) is a recursive definition and to determine the value of V(b) for a particular board state, it performs the search ahead for the optimal line of play, all the way to the end of the game. So this definition is not efficiently computable by our checkers playing program, we say that it is a non- operational definition. Choosing a representation for the Target Function: Now that we have specified the ideal target function V, we must choose a representation that the learning program will use to describe the function ^V that it will learn. As with earlier design choices, we again have many options. We could, for example, allow the program to represent using a large table with a distinct entry specifying the value for each distinct board state. Or we could allow it to represent using a collection of rules that match against features of the board state, or a quadratic polynomial function of predefined board features, or an artificial neural network. In general, this choice of representation involves a crucial trade off. On one hand, we wish to pick a very expressive representation to allow representing as close an approximation as possible to the ideal target function V. On the other hand, the more expressive the representation, the more training data the program will require in order to choose among the alternative hypotheses it can represent. To keep the discussion brief, let us choose a simple representation: for any given board state, the function ^V will be calculated as a linear combination of the following board features: •x1(b) — number of black pieces on board b •x2(b) — number of red pieces on b •x3(b) — number of black kings on b 10
Department of CSE MRCET •x4(b) — number of red kings on b •x5(b) — number of red pieces threatened by black • x6(b) — number of black pieces threatened by red ^V = w0 + w1 · x1(b) + w2 · x2(b) + w3 · x3(b) + w4 · x4(b) +w5 · x5(b) + w6 · x6(b) Where w0 through w6 are numerical coefficients or weights to be obtained by a learning algorithm. Weights w1 to w6 will determine the relative importance of different board features. Specification of the Machine Learning Problem at this time: Till now we worked on choosing the type of training experience, choosing the target function and its representation. The checkers learning task can be summarized as below. •Task T: Play Checkers •Performance Measure: % of games won in world tournament •Training Experience E: opportunity to play against itself •Target Function: V: Board → R •Target Function Representation: ^V = w0 + w1 · x1(b) + w2 · x2(b) + w3 · x3(b) + w4 · x4(b) +w5 · x5(b) + w6 · x6(b) The first three items above correspond to the specification of the learning task, where as the final two items constitute design choices for the implementation of the learning program. Choosing an approximation algorithm for the Target Function: Generating training data — To train our learning program, we need a set of training data, each describing a specific board state b and the training value V_train (b) for b. Each training example is an ordered pair <b,v_train(b)>. 11
Department of CSE MRCET Temporal difference (TD) learning is a concept central to reinforcement learning, in which learning happens through the iterative correction of your estimated returns towards a more accurate target return. V_train(b) ← ^V(Successor(b)) Final Design for Checkers Learning system: The final design of our checkers learning system can be naturally described by four distinct program modules that represent the central components in many learning systems. 1.The performance System: Takes a new board as input and outputs a trace of the game it played against itself. 2.The Critic: Takes the trace of a game as an input and outputs a set of training examples of the target function. 3.The Generalizer: Takes training examples as input and outputs a hypothesis that estimates the target function. Good generalization to new cases is crucial. 4.The Experiment Generator: Takes the current hypothesis (currently learned function) as input and outputs a new problem (an initial board state) for the performance system to explore. Issues in Machine Learning: 12
Department of CSE MRCET Our checkers example raises a number of generic questions about machine learning. The field of machine learning, and much of this book, is concerned with answering questions such as the following: •What algorithms exist for learning general target functions from specific training examples? In what settings will particular algorithms converge to the desired function, given sufficient training data? Which algorithms perform best for which types of problems and representations? •How much training data is sufficient? What general bounds can be found to relate the confidence in learned hypotheses to the amount of training experience and the character of the learner's hypothesis space? •When and how can prior knowledge held by the learner guide the process of generalizing from examples? Can prior knowledge be helpful even when it is only approximately correct? •What is the best strategy for choosing a useful next training experience, and how does the choice of this strategy alter the complexity of the learning problem? •What is the best way to reduce the learning task to one or more function approximation problems? Put another way, what specific functions should the system attempt to learn? Can this process itself be automated? •How can the learner automatically alter its representation to improve its ability to represent and learn the target function? CONCEPT LEARNING: •Inducing general functions from specific training examples is a main issue of machine learning. •Concept Learning: Acquiring the definition of a general category from given sample positive and negative training examples of the category. •Concept Learning can see as a problem of searching through a predefined space of potential hypotheses for the hypothesis that best fits the training examples. •The hypothesis space has a general-to-specific ordering of hypotheses, and the search can be efficiently organized by taking advantage of a naturally occurring structure over the hypothesis space. A Formal Definition for Concept Learning: 13
Department of CSE MRCET Inferring a Boolean-valued function from training examples of its input and output. •An example for concept-learning is the learning of bird-concept from the given examples of birds (positive examples) and non-birds (negative examples). •We are trying to learn the definition of a concept from given examples. A Concept Learning Task: Enjoy Sport Training Examples A set of example days, and each is described by six attributes. The task is to learn to predict the value of Enjoy Sport for arbitrary day, based on the values of its attribute values. Concept Learning as Search: • Concept learning can be viewed as the task of searching through a large space of hypotheses implicitly defined by the hypothesis representation. The goal of this search is to find the hypothesis that best fits the training examples. By selecting a hypothesis representation, the designer of the learning algorithm implicitly defines the space of all hypotheses that the program can ever represent and therefore can ever learn. • • 14
Department of CSE MRCET FIND-S: • FIND-S Algorithm starts from the most specific hypothesis and generalize it by considering only positive examples. FIND-S algorithm ignores negative example : As long as the hypothesis space contains a hypothesis that describes the true target concept, and the training data contains no errors, ignoring negative examples does not cause to any problem. FIND-S algorithm finds the most specific hypothesis within H that is consistent with the positive training examples. – The final hypothesis will also be consistent with negative examples if the correct target concept is in H, and the training examples are correct. • • FIND-S Algorithm: 1. Initialize h to the most specific hypothesis in H 2. For each positive training instance x For each attribute constraint a, in h If the constraint a, is satisfied by x Then do nothing 3.Else replace a, in h by the next more general constraint that is satisfied by x 4. Output hypothesis h FIND-S Algorithm – Example: Important-Representation: 1.? indicates that any value is acceptable for the attribute. 2.specify a single required value (e.g., Cold) for the attribute. 3.Φindicates that no value is acceptable. 4.The most general hypothesis is represented by: {?, ?, ?, ?, ?, ?} 5.The most specific hypothesis is represented by: {ϕ,ϕ,ϕ,ϕ,ϕ,ϕ} Steps Involved in Find-S: 1.Start with the most specific hypothesis. h = {ϕ,ϕ,ϕ,ϕ,ϕ,ϕ} 15
Department of CSE MRCET 2.Take the next example and if it is negative, then no changes occur to the hypothesis. 3.If the example is positive and we find that our initial hypothesis is too specific then we update our current hypothesis to a general condition. 4.Keep repeating the above steps till all the training examples are complete. 5.After we have completed all the training examples we will have the final hypothesis when can use to classify the new examples. Example: Consider the following data set having the data about which particular seeds are poisonous. First, we consider the hypothesis to be a more specific hypothesis. Hence, our hypothesis would be: h = {ϕ, ϕ,ϕ,ϕ,ϕ,ϕ} Consider example 1: The data in example 1 is {GREEN, HARD, NO, WRINKLED}. We see that our initial hypothesis is more specific and we have to generalize it for this example. Hence, the hypothesis becomes: h = {GREEN, HARD, NO, WRINKLED} Consider example 2: 16
Department of CSE MRCET Here we see that this example has a negative outcome. Hence we neglect this example and our hypothesis remains the same. h = {GREEN, HARD, NO, WRINKLED} Consider example 3: Here we see that this example has a negative outcome. hence we neglect this example and our hypothesis remains the same. h = {GREEN, HARD, NO, WRINKLED} Consider example 4: The data present in example 4 is {ORANGE, HARD, NO, WRINKLED}. We compare every single attribute with the initial data and if any mismatch is found we replace that particular attribute with a general case (“ ?”). After doing the process the hypothesis becomes: h = {?, HARD, NO, WRINKLED } Consider example 5: The data present in example 5 is {GREEN, SOFT, YES, SMOOTH}. We compare every single attribute with the initial data and if any mismatch is found we replace that particular attribute with a general case ( “?” ). After doing the process the hypothesis becomes: h = {?, ?, ?, ? } Since we have reached a point where all the attributes in our hypothesis have the general condition, example 6 and example 7 would result in the same hypothesizes with all general attributes. h = {?, ?, ?, ? } Hence, for the given data the final hypothesis would be: Final Hypothesis: h = { ?, ?, ?, ? }. Version Spaces Definition(Version space). A concept is complete if it covers all positive examples. A concept is consistent if it covers none of the negative examples. The version space is the set of all complete and consistent concepts. This set is convex and is fully defined by its least and most general elements. Candidate-Elimination Learning Algorithm 17
Department of CSE MRCET The CANDIDATE-ELIMINTION algorithm computes the version space containing all hypotheses from H that are consistent with an observed sequence of training examples. Initialize G to the set of maximally general hypotheses in H Initialize S to the set of maximally specific hypotheses in H For each training example d, do • • • • If d is a positive example Remove from G any hypothesis inconsistent with d For each hypothesis s in S that is not consistent with d Remove s from S • Add to S all minimal generalizations h of s such that h is consistent with d, and some member of G is more general than h Remove from S any hypothesis that is more general than another hypothesis in S If d is a negative example Remove from S any hypothesis inconsistent with d For each hypothesis g in G that is not consistent with d Remove g from G 18\ Add to G all minimal specializations h of g such that h is consistent with d, and some member of S is more specific than h Remove from G any hypothesis that is less general than another hypothesis in G. • • • • • • • • CANDIDATE- ELIMINTION algorithm using version spaces An Illustrative Example: 18
Department of CSE MRCET CANDIDATE-ELIMINTION algorithm begins by initializing the version space to the set of all hypotheses in H; boundary set to contain the most general hypothesis in H, G0 ?, ?, ?, ?, ?, When the first training example is presented, the CANDIDATEELIMINTION algorithm checks the S boundary and finds that it is overly specific and it fails to cover the positive example. • The boundary is therefore revised by moving it to the least more general hypothesis that covers this new example. No update of the G boundary is needed in response to this training example because Go correctly covers this example. • • When the second training example is observed, it has a similar effect of generalizing S further to S2, leaving G again unchanged i.e., G2 = G1 =G0 19
Department of CSE MRCET • Consider the third training example. This negative example reveals that the boundary of the version space is overly general, that is, the hypothesis in G incorrectly predicts that this new example is a positive example. The hypothesis in the G boundary must therefore be specialized until it correctly classifies this new negative example. • Given that there are six attributes that could be specified to specialize G2, why are there only three new hypotheses in G3? For example, the hypothesis h = (?, ?, Normal, ?, ?, ?) is a minimal specialization of G2 that correctly labels the new example as a negative example, but it is not included in G3. The reason this hypothesis is excluded is that it is inconsistent with the previously encountered positive examples. Consider the fourth training example. 20
Department of CSE MRCET • This positive example further generalizes the S boundary of the version space. It also results in removing one member of the G boundary, because this member fails to cover the new positive example After processing these four examples, the boundary sets S4 and G4 delimit the version space of all hypotheses consistent with the set of incrementally observed training examples. After processing these four examples, the boundary sets S4 and G4 delimit the version space of all hypotheses consistent with the set of incrementally observed training examples. • Inductive bias: 21
Department of CSE MRCET Decision Tre:e Decision Trees are a type of Supervised Machine Learning (that is you explain what the input is and what the corresponding output is in the training data) where th e data is continuously split according to a certain parameter. The tree can be explained by two entities, namely decision nodes and leaves. The leaves are the decisions or the final outcomes. And the decision nodes are where the data is split. Decision Tree Representation: An example of a decision tree can be explained using above binary tree. Let’s say you want to predict whether a person is fit given their information like age, eating habit, and physical activity, etc. The decision nodes here are questions like ‘What’s the age?’,‘Doeshe exercise?’, and ‘Does he eat a lot of pizzas’? And the leaves, which are outcomes like either ‘fit’, or ‘unfit’. In this case this was a binary classification problem (a yes no type problem). There are two main types of Decision Trees: 1.Classification trees (Yes/No types): What we have seen above is an example of classification tree, where the outcome was a variable like ‘fit’ or ‘unfit’. Here the decision variable is Categorical. Inductive bias refers to the restriction2s2 that are imposed by the assumptions
Department of CSE MRCET Here the decision or the outcome variable is Continuous, e.g. a number like 123. Working Now that we know what a Decision Tree is, we’ll see how it works internally. There are many algorithms out there which construct Decision Trees, but one of the best is called as ID3 Algorithm. ID3 Stands for Iterative Dichotomiser3. Before discussing the ID3 algorithm, we’ll go through few definitions. Entropy, also called as Shannon Entropy is denoted by H(S) for a finite set S, is the measure of the amount of uncertainty or randomness in data. Appropriate Problems for Decision Tree Learning: •Instances are represented by attribute-value pair •The target function has discrete output values •Disjunctive descriptions may be required •The training data may contain errors •The training data may contain missing attribute values. •Suitable for classifications. Hypothesis Space Search: The set of possible decision tree, Simple to complex, hill climbing search. Capability: •Hypothesis space of all decision trees is a complete space of finite discrete valued functions. •ID3 maintains only a single current hypothesis. •Cannot determine how many alternative decision trees are consistent with the available training data. 23
Department of CSE MRCET •ID3 uses all training example at each step to make statistically based decisions regarding how to refine its current hypothesis. •The resulting search is much less sensitive to errors in individual training examples. Inductive Bias in Decision Tree Learning: Note H is the power set of instances X •Inductive Bias in ID3 – Approximate inductive bias of ID3 Shorter trees are preferred over larger tress BFS-ID3 Difference between (ID3 & C-E) && Restriction bias and Preference bias ID3 Candidate-Elimination Searches a complete hypothesis space incompletely Searches an incomplete hypothesis space completely Inductive bias is solely a consequence of the expressive power of its hypothesis representation Inductive bias is solely a consequence of the ordering of hypotheses by its search strategy sss Restriction bias Preference bias Candidate-Elimination ID3 Categorical restriction on the set of hypotheses considered Preference for certain hypotheses over others 24
Department of CSE MRCET Possibility of excluding the unknown target function Work within a complete hypothesis space Issues in Decision Tree Learning: •Determine how deeply to grow the decision tree •Handling continuous attributes •Choosing an appropriate attribute selection measure •Handling training data with missing attribute values •Handling attributes with differing costs •Improving computational efficiency 25
Department of CSE MRCET UNIT-II Artificial Neural Networks Introduction: Artificial Neural Networks (ANN) are algorithms based on brain function and are used to model complicated patterns and forecast issues. The Artificial Neural Network (ANN) is a deep learning method that arose from the concept of the human brain Biological Neural Networks. The development of ANN was the result of an attempt to replicate the workings of the human brain. The workings of ANN are extremely similar to those of biological neural networks, although they are not identical. ANN algorithm accepts only numeric and structured data. The ANN applications: Classification, the aim is to predict the class of an input vector •Pattern matching, the aim is to produce a pattern best associated with a given input vector. •Pattern completion, the aim is to complete the missing parts of a given input vector. •Optimization, the aim is to find the optimal values of parameters in an optimization problem. •Control, an appropriate action is suggested based on given an input vectors •Function approximation/times series modelling, the aim is to learn the functional relationships between input and desired output vectors. •Data mining, with the aim of discovering hidden patterns from data (knowledge discovery). ANN architectures •Neural Networks are known to be universal function approximators •Various architectures are available to approximate any nonlinear function •Different architectures allow for generation of functions of different complexity and power Feed forward networks Feedback networks Lateral networks 26
Department of CSE MRCET Advantages of Artificial Neural Networks Attribute-value pairs are used to represent problems in ANN. 1.The output of ANNs can be discrete-valued, real-valued, or a vector of multiple real or discrete-valued characteristics, while the target function can be discrete-valued, real-valued, or a vector of numerous real or discrete- valued attributes. 2.Noise in the training data is not a problem for ANN learning techniques. There may be mistakes in the training samples, but they will not affect the final result. 3.It’s utilized when a quick assessment of the taught target function is necessary. 4.The number of weights in the network. 5.the number of training instances evaluated, and the settings of different learning algorithm parameters can all contribute to extended training periods for ANNs. Disadvantages of Artificial Neural Networks 1.Hardware Dependence: • The construction of Artificial Neural Networks necessitates the use parallel processors. As a result, the equipment’s realization is contingent. of • 2.Understanding the network’s operation: • • This is the most serious issue with ANN. When ANN provides a probing answer, it does not explain why or how it was chosen. As a result, the network’s confidence is eroded. • 3.Assured network structure: 27
Department of CSE MRCET •Any precise rule does not determine the structure of artificial neural networks. •Experience and trial and error are used to develop a suitable network structure. 4.Difficulty in presenting the issue to the network: • ANNs are capable of working with numerical data. • Before being introduced to ANN, problems must be converted into numerical values. The display method that is chosen will have a direct impact on the network’s performance. The user’s skill is a factor here. • • 5.The network’s lifetime is unknown: •When the network’s error on the sample is decreased to a specific amount, the training is complete. • The value does not produce the best outcomes. Appropriate Problems for Neural Network Learning: 1.Instances are represented by many attribute-value pairs (e.g., the pixels of a picture. ALVINN [Mitchell, p. 84]). 2.The target function output may be discrete-valued, real-valued, or a vector of several real- or discrete-valued attributes. 3.The training examples may contain errors. 4.Long training times are acceptable. 5.Fast evaluation of the learned target function may be required. 6.The ability for humans to understand the learned target function is not important. History of Neural Networks: 1.1943: McCulloch and Pitts proposed a model of a neuron Perceptron (read [Mitchell, section 4.4]) 2.1960s: Widrow and Hoff explored Perceptron networks (which they called “Adelines”) and the delta rule. 3.1962: Rosenblatt proved the convergence of the perceptron training rule. 28
Department of CSE MRCET 4.1969: Minsky and Papert showed that the Perceptron cannot deal with nonlinearly-separable data sets---even those that represent simple function such as X-OR. 5.1970-1985: Very little research on Neural Nets 6.1986: Invention of Backpropagation Rumelhart and McClelland, but also Parker and earlier on: Werbos which can learn from nonlinearly-separable data sets. 7.Since 1985: A lot of research in Neural Nets! Multilayer Neural Network: •A multiplayer perceptron is a feed forward neural network with one or more hidden layers •The network consists of an input layer of source neurons, at least one hidden layer of computational neurons, and an output layer of computational neurons. •The input signals are propagated in a forward direction on a layer-by-layer basis. •Neurons in the hidden layer cannot be observed through input/output behaviour of the network. •There is no obvious way to know what the desired output of the hidden layer should be. 29
Department of CSE MRCET 30
Department of CSE MRCET 31
Department of CSE MRCET Back propagation: Overview •Back propagation works by applying the gradient descent rule to a feed forward network. •The algorithm is composed of two parts that get repeated over and over until a pre-set maximal number of epochs, EP max. •Part I, the feed forward pass: the activation values of the hidden and then output units are computed. •Part II, the back propagation pass: the weights of the network are updated- starting with the hidden to output weights and followed by the input to hidden weights--with respect to the sum of squares error and through a series of weight update rules called the Delta Rule. Definition: The Back propagation algorithm in neural network computes the gradient of the loss function for a single weight by the chain rule. It efficiently computes one layer at a time, unlike a native direct computation. It computes the gradient, but it does not define how the gradient is used. It generalizes the computation in the delta rule. Consider the following Back propagation neural network example diagram to understand: 32
Department of CSE MRCET 1. Inputs X, arrive through the preconnected path •Inputs X, arrive through the preconnected path •Input is modelled using real weights W. The weights are usually randomly selected. •Calculate the output for every neuron from the input layer, to the hidden layers, to the output layer. •Calculate the error in the outputs ErrorB= Actual Output – Desired Output •Travel back from the output layer to the hidden layer to adjust the weights such that the error is decreased. •Keep repeating the process until the desired output is achieved Why We Need Back propagation? •Most prominent advantages of Back propagation are: •Back propagation is fast, simple and easy to program •It has no parameters to tune apart from the numbers of input •It is a flexible method as it does not require prior knowledge about the network •It is a standard method that generally works well •It does not need any special mention of the features of the function to be learned. 33
Department of CSE MRCET Types of Back propagation Networks Two Types of Back propagation Networks are: •Static Back-propagation •Recurrent Back propagation Static back-propagation: It is one kind of back propagation network which produces a mapping of a static input for static output. It is useful to solve static classification issues like optical character recognition. Recurrent Back propagation: Recurrent Back propagation in data mining is fed forward until a fixed value is achieved. After that, the error is computed and propagated backward. Disadvantages of using Back propagation •The actual performance of back propagation on a specific problem is dependent on the input data. •Back propagation algorithm in data mining can be quite sensitive to noisy data •You need to use the matrix-based approach for back propagation instead of mini-batch. Back propagation: The Algorithm •Initialize the weights to small random values; create a random pool of all the training patterns; set EP, the number of epochs of training to 0. •2. Pick a training pattern from the remaining pool of patterns and propagate it forward through the network. •3. Compute the deltas, k for the output layer. •4. Compute the deltas, backward. •Update all the connections such that •W Newji = wjiold + wji and w Newkj for the hidden layer by propagating the error j = wkjOld + wkj 34
Department of CSE MRCET •If any pattern remains in the pool, then go back to Step 2. If all the training patterns in the pool have been used, then set EP = EP+1, and if EP EPMax, then create a random pool of patterns and go to Step 2. If EP = EPMax, then stop. Back propagation: The Momentum: •To this point, Back propagation has the disadvantage of being too slow if is small and it can oscillate too widely if is large. •To solve this problem, we can add a momentum to give each connection some inertia, forcing it to change in the direction of the downhill “force”. •New Delta Rule: wpq(t+1) = - E/ wpq + wpq(t) •Where p and q are any input and hidden, or, hidden and output units; t is a time step or epoch; and is the momentum parameter which regulates the amount of inertia of the weights. 35
Department Of CSE MRCET UNIT - III Introduction to Bayesian Learning Imagine a situation where your friend gives you a new coin and asks you the fairness of the coin (or the probability of observing heads) without even flipping the coin once. In fact, you are also aware that your friend has not made the coin biased. In general, you have seen that coins are fair, thus you expect the probability of observing heads is 0.50.5. In the absence of any such observations, you assert the fairness of the coin only using your past experiences or observations with coins. Suppose that you are allowed to flip the coin 1010 times in order to determine the fairness of the coin. Your observations from the experiment will fall under one of the following cases: •Case 1: observing 55 heads and 55 tails. •Case 2: observing hh heads and 10−h10−h tails, where h≠10−hh≠10−h. If case 1 is observed, you are now more certain that the coin is a fair coin, and you will decide that the probability of observing heads is 0.50.5 with more confidence. If case 2 is observed you can either: 1.Neglect your prior beliefs since now you have new data, decide the probability of observing heads is h/10h/10 by solely depending on recent observations. 2.Adjust your belief accordingly to the value of hh that you have just observed, and decide the probability of observing heads using your recent observations. The first method suggests that we use the frequentist method, where we omit our beliefs when making decisions. However, the second method seems to be more convenient because 1010 coins are insufficient to determine the fairness of a coin. Therefore, we can make better decisions by combining our recent observations and beliefs that we have gained through our past experiences. It is this thinking model which uses our most recent observations together with our beliefs or inclination for critical thinking that is known as Bayesian thinking. 36
Department Of CSE MRCET Moreover, assume that your friend allows you to conduct another 1010 coin flips. Then we can use these new observations to further update our beliefs. As we gain more data, we can incrementally update our beliefs increasing the certainty of our conclusions. This is known as incremental learning, where you update your knowledge incrementally with new evidence. Bayesian learning comes into play on such occasions, where we are unable to use frequentist statistics due to the drawbacks that we have discussed above. We can use Bayesian learning to address all these drawbacks and even with additional capabilities (such as incremental updates of the posterior) when testing a hypothesis to estimate unknown parameters of a machine learning models. Bayesian learning uses Bayes’ theorem to determine the conditional probability of a hypotheses given some evidence or observations. The Famous Coin Flip Experiment When we flip a coin, there are two possible outcomes - heads or tails. Of course, there is a third rare possibility where the coin balances on its edge without falling onto either side, which we assume is not a possible outcome of the coin flip for our discussion. We conduct a series of coin flips and record our observations i.e. the number of the heads (or tails) observed for a certain number of coin flips. In this experiment, we are trying to determine the fairness of the coin, using the number of heads (or tails) that we observe. Frequentist Statistics Let us think about how we can determine the fairness of the coin using our observations in the above mentioned experiment. Once we have conducted a sufficient number of coin flip trials, we can determine the frequency or the probability of observing the heads (or tails). If we observed heads and tails with equal frequencies or the probability of observing heads (or tails) is 0.50.5, then it can be established that the coin is a fair coin. Failing that, it is a biased coin. Let's denote pp as the probability of observing the heads. Consequently, as the quantity that pp deviates from 0.50.5 indicates how biased the coin is, pp can be considered as the degree-of-fairness of the coin. 37
Department Of CSE MRCET Testing whether a hypothesis is true or false by calculating the probability of an event in a prolonged experiment is known as frequentist statistics. As such, determining the fairness of a coin by using the probability of observing the heads is an example of frequentist statistics (a.k.a. frequentist approach). Let us now further investigate the coin flip example using the frequentist approach. Since we have not intentionally altered the coin, it is reasonable to assume that we are using an unbiased coin for the experiment. When we flip the coin 1010 times, we observe the heads 66 times. Therefore, the pp is 0.60.6 (note that pp is the number of heads observed over the number of total coin flips). Hence, according to frequencies statistics, the coin is a biased coin — which opposes our assumption of a fair coin. Perhaps one of your friends who is more skeptical than you extends this experiment to 100100 trails using the same coin. Then she observes heads 5555 times, which results in a different pp with 0.550.55. Even though the new value for pp does not change our previous conclusion (i.e. that the coin is biased), this observation raises several questions: •How confident are we of pp being 0.60.6? •How confident are of pp being 0.550.55? •Which of these values is the accurate estimation of pp? 38
Department of CSE MRCET Will pp continue to change when we further increase the number of coin flip trails? We cannot find out the exact answers to the first three questions using frequentist statistics. We may assume that true value of pp is closer to 0.550.55 than 0.60.6 because the former is computed using observations from a considerable number of trials compared to what we used to compute the latter. Yet there is no way of confirming that hypothesis. However, if we further increase the number of trials, we may get a different probability from both of the above values for observing the heads and eventually, we may even discover that the coin is a fair coin. Number of coin Number of heads flips 10 6 50 29 100 55 200 94 500 245 Table 1 - Coin flip experiment results when increasing the number of trials Probability of observing heads 0.6 0.58 0.55 0.47 0.49 Table 1 presents some of the possible outcomes of a hypothetical coin flip experiment when we are increasing the number of trials. The fairness (pp) of the coin changes when increasing the number of coin-flips in this experiment. Our confidence of estimated pp may also increase when increasing the number of coin-flips, yet the frequentist statistic does not facilitate any indication of the confidence of the estimated pp value. We can attempt to understand the importance of such a confident measure by studying the following cases: •An experiment with an infinite number of trials guarantees pp with absolute accuracy (100% confidence). Yet, it is not practical to conduct an experiment with an infinite number of trials and we should stop the experiment after a sufficiently large number of trials. However, deciding the value of this sufficient number of trials is a challenge when using frequentist statistics. If we can determine the confidence of the estimated pp value or the inferred conclusion, in a situation where the number of trials is limited, this will allow 39
Department Of CSE MRCET us to decide whether to accept the conclusion or to extend the experiment with more trials until it achieves sufficient confidence. Moreover, we may have valuable insights or prior beliefs (for example, coins are usually fair and the coin used is not made biased intentionally, therefore p≈0.5p≈0.5) that describes the value of pp. Embedding that information can significantly improve the accuracy of the final conclusion. Such beliefs play a significant role in shaping the outcome of a hypothesis test especially when we have limited data. However, with frequentist statistics, it is not possible to incorporate such beliefs or past experience to increase the accuracy of the hypothesis test. Some Terms to Understand Before delving into Bayesian learning, it is essential to understand the definition of some terminologies used. I will not provide lengthy explanations of the mathematical definition since there is a lot of widely available content that you can use to understand these concepts. •Random variable (Stochastic variable) - In statistics, the random variable is a variable whose possible values are a result of a random event. Therefore, each possible value of a random variable has some probability attached to it to represent the likelihood of those values. •Probability distribution - The function that defines the probability of different outcomes/values of a random variable. The continuous probability distributions are described using probability density functions whereas discrete probability distributions can be represented using probability mass functions. Conditional probability - This is a measure of probability P(A|B)P(A|B) of an event A given that another event B has occurred. •Joint probability distribution Bayes’ Theorem Bayes’ theorem describes how the conditional probability of an event or a hypothesis can be computed using evidence and prior knowledge. It is similar to concluding that our code has no bugs given the evidence that it has passed 40
Department Of CSE MRCET all the test cases, including our prior belief that we have rarely observed any bugs in our code. However, this intuition goes beyond that simple hypothesis test where there are multiple events or hypotheses involved (let us not worry about this for the moment). The Bayes’ theorem is given by: P(θ|X)=P(X|θ)P(θ)P(X)P(θ|X)=P(X|θ)P(θ)P(X) I will now explain each term in Bayes’ theorem using the above example. Consider the hypothesis that there are no bugs in our code. θθ and XX denote that our code is bug free and passes all the test cases respectively. •P(θ)P(θ) - Prior Probability is the probability of the hypothesis θθ being true before applying the Bayes’ theorem. Prior represents the beliefs that we have gained through past experience, which refers to either common sense or an outcome of Bayes’ theorem for some past observations. For the example given, prior probability denotes the probability of observing no bugs in our code. However, since this is the first time we are applying Bayes’ theorem, we have to decide the priors using other means (Otherwise we could use the previous posterior as the new prior). Let us assume that it is very unlikely to find bugs in our code because rarely have we observed bugs in our code in the past. With our past experience of observing fewer bugs in our code, we can assign our prior P(θ)P(θ) with a higher probability. However, for now, let us assume that P(θ)=pP(θ) This term depends on the test coverage of the test cases. Even though we do not know the value of this term without proper measurements, in order to continue this discussion let us assume that P(X|¬θ)=0.5P(X|¬θ)=0.5. Accordingly, P(X)=1×p+0.5×(1−p)=0.5(1+p)P(X)=1×p+0.5×(1−p)=0.5(1+p) •P(θ|X)P(θ|X) - Posteriori probability denotes the conditional probability of the hypothesis θθ after observing the evidence XX. This is the probability of observing no bugs in our code given that it passes all the test cases. Since we 41
Department Of CSE MRCET now know the values for the other three terms in the Bayes’ theorem, we can calculate the posterior probability using the following formula: P(θ|X)=1×p0.5(1+p)P(θ|X)=1×p0.5(1+p) We can also calculate the probability of observing a bug, given that our code passes all the test cases P(¬θ|X)P(¬θ|X) . P(¬θ|X)=P(X|¬θ).P(¬θ)P(X)=0.5×(1−p)0.5×(1+p)=(1−p)(1+p)P(¬θ|X)=P(X|¬ θ).P(¬θ) P(X)=0.5×(1−p)0.5×(1+p)=(1−p)(1+p) We now know both conditional probabilities of observing a bug in the code and not observing the bug in the code. Yet how are we going to confirm the valid hypothesis using these posterior probabilities? Maximum a Posteriori (MAP) We can use MAP to determine the valid hypothesis from a set of hypotheses. According to MAP, the hypothesis that has the maximum posterior probability is considered as the valid hypothesis. Therefore, we can express the hypothesis θMAPθMAP that is concluded using MAP as follows: θMAP=argmaxθP(θi|X)=argmaxθ(P(X|θi)P(θi)P(X))θMAP=argmaxθP(θi|X) =argmaxθ(P(X|θi)P(θi)P(X)) The argmaxθargmaxθ operator estimates the event or hypothesis θiθi that maximizes the posterior probability P(θi|X)P(θi|X). Let us apply MAP to the above example in order to determine the true hypothesis: θMAP=argmaxθ{θ:P(θ|X)=p0.5(1+p),¬θ:P(¬θ|X)=(1−p)(1+p)}θMAP=argma xθ{θ:P(θ|X)=p0.5(1+p),¬θ:P(¬θ|X)=(1−p)(1+p)} 42
Department Of CSE MRCET Figure 1 - P(θ|X)P(θ|X) and P(¬θ|X)P(¬θ|X) when changing the P(θ)=pP(θ)=p Figure 1 illustrates how the posterior probabilities of possible hypotheses change with the value of prior probability. Unlike frequentist statistics where our belief or past experience had no influence on the concluded hypothesis, Bayesian learning is capable of incorporating our belief to improve the accuracy of predictions. Assuming that we have fairly good programmers and therefore the probability of observing a bug is P(θ)=0.4P(θ)=0.4 , then we find the θMAPθMAP: MAP=argmaxθ{θ:P(|X)=0.40.5(1+0.4),¬θ:P(¬θ|X)=0.5(1−0.4)0.5(1+0.4)}=ar gmaxθ{θ:P(θ|X)=0.57,¬θ:P(¬θ|X)=0.43}=θ⟹No bugs present in our codeMAP=argmaxθ{θ:P(|X)=0.40.5(1+0.4),¬θ:P(¬θ|X)=0.5(1−0.4)0.5(1+0.4 )}=argmaxθ{θ:P(θ|X)=0.57,¬θ:P(¬θ|X)=0.43}=θ⟹No bugs present in our code 43
Department Of CSE MRCET However, P(X)P(X) is independent of θθ, and thus P(X)P(X) is same for all the events or hypotheses. Therefore, we can simplify the θMAPθMAP estimation, without the denominator of each posterior computation as shown below: θMAP=argmaxθ(P(X|θi)P(θi))θMAP=argmaxθ(P(X|θi)P(θi)) Notice that MAP estimation algorithms do not compute posterior probability of each hypothesis to decide which is the most probable hypothesis. Assuming that our hypothesis space is continuous (i.e. fairness of the coin encoded as probability of observing heads, coefficient of a regression model, etc.), where endless possible hypotheses are present even in the smallest range that the human mind can think of, or for even a discrete hypothesis space with a large number of possible outcomes for an event, we do not need to find the posterior of each hypothesis in order to decide which is the most probable hypothesis. Therefore, the practical implementation of MAP estimation algorithms use approximation techniques, which are capable of finding the most probable hypothesis without computing posteriors or only by computing some of them. Using the Bayesian theorem, we can now incorporate our belief as the prior probability, which was not possible when we used frequentist statistics. However, we still have the problem of deciding a sufficiently large number of trials or attaching a confidence to the concluded hypothesis. This is because the above example was solely designed to introduce the Bayesian theorem and each of its terms. Let us now gain a better understanding of Bayesian learning to learn about the full potential of Bayes’ theorem. Binomial Likelihood The likelihood for the coin flip experiment is given by the probability of observing heads out of all the coin flips given the fairness of the coin. As we have defined the fairness of the coins (θθ) using the probability of observing heads for each coin flip, we can define the probability of observing heads or 44