Download

1 / 10
100 likes | 120 Views
The Indian e-tailing ecosystem always had a high share of mobile devices category, with the figure often exceeding 50% of all GMV in certain quarters. E Tailing Market.<br><br>https://redseer.com/newsletters/e-tailing-market-updates-july18/

E N D
Flexible in Approach, Firm on Results Flexible in Approach, Firm on Results E-tailing in India: Redseer Perspective Published in Feb 2018 | © © 2011 RedSeer Consulting Confidential `and Proprietary Information 2017 RedSeer Consulting Confidential `and Proprietary Information www.redseerconsulting.com www.redseerconsulting.com Query@redseerconsulting.com Query@redseerconsulting.com 1
GMV Performance Industry growth momentum resumed in 2017 as it witnessed 23% Y-o-Y growth reaching ~18 Bn Note: 1 $ = INR 60 Indian E-Tailing Market- Gross GMV (For Each Year, In USD Bn ) 28 17.8 14.5 13 4.5 2014 2015 2016 2017 2018F Industry expected to grow faster compared to previous years GMV growth slows but GMV ‘quality’ and unit economics improve Industry growth momentum continues Breakneck growth continues Breakout year for sector Flipkart crosses USD 4 bn GMV run-rate while Snapdeal and Amazon touch USD 3 bn Flipkart crosses USD 1 bn GMV Largest ever monthly GMV for sector in Sepy’17 (sales) month Bigger horizontals are expected to drive growth One of the biggest player Snapdeal losses market share Amazon, Snapdeal grow rapidly | 2 Source: RedSeer analysis
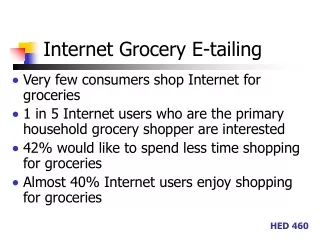
Category Performance Mobiles continues to be the highest selling category; Share of fashion category has been consistently decreasing Indian E-Tailing Market- Category Share of Gross GMV (Y-o-Y ) Others 4% 6% 6% 6% 4% 6% 5% 5% 5% FMCG 17% 21% 23% Home 18% 20% 22% Fashion Electronic Devices/Non- Devices 50% 44% 38% Mobile 2015 2016 2017 Key takeaways • Market share for mobile category has continuously seen an increase, half of the E-tailing business is being driven by the category as of 2017 • Among smaller categories- share of Home and FMCG category increased in 2017 | Source: RedSeer analysis 3
Market Share Flipkart group was the biggest winner of 2017 with ~47% market share, 500bps improvement from 2016 Indian E-Tailing Market-Share of Gross GMV (Y-o-Y ) 9% 7% Others 9% 4% 3% 11% 5% Snapdeal 23% 4% 5% Shopclues 4% 33% 4% Paytm 30% 19% 1% Amazon 6% 2% 2% 4% 6% Jabong 40% Myntra 35% 34% Flipkart 2015 2016 2017 Note: 1) Paytm O2O numbers are not included 2) Share of Ebay os <1% in overall GMV | 4 Source: RedSeer analysis
Industry Growth Industry growth would be driven by bigger horizontals in 2018 as witnessed in 2017 Cumulative growth, % (Y-o-Y, CY 2016-17) Insights Market Share, % (CY 2016) GMV growth, % (Y-o-Y growth, CY 2016-17) Bigger are expected to lead the growth in 2018 as well and further consolidate share horizontals 45% Flipkart market Bigger Horizontals 47% 70% 42% Amazon Smaller are expected to grow faster compared to 2017. would lead the growth with Snapdeal being relatively stable horizontals 25% Paytm Shopclues 25% Shopclues -39% 14% Smaller Horizontals Snapdeal -58% Bigger Myntra would grow others, smaller verticals might witness limited growth verticals and continue faster like Jabong to than 10% Verticals and Others 16% 6% however Note: Small horizontals are players with <5% market share | 5 Source: RedSeer analysis
Sale vs Non-Sale GMV performance Indian e-tailing market is sale driven like China as ~30% of Industry GMV was contributed by 10% of the days (Sale Days) in 2017 Relative Market Share (%) AOV ($) Daily Transactions (MN) Industry GMV (Sale vs Non-sale) Flipkart Amazon Sale Days Non Sale Days 30% 35% $50 3 47% 1.3x 3x 70% 65% $35 1.1 53% Non Sale Days Sale Days Overall GMV Flipkart witnessed higher jump in sales (3-4X) compared to Amazon(2-3X) during all sale events in 2017 owing to its efficient marketing and attractive prices during sale events Note: 1. Jan, May, Jun, Aug, Sept, Oct, Dec are considered sale months 2. Total number of sale days considered are 35 | 6 Source: RedSeer analysis
City-Tier wise customer growth Tier-II+ would be the mainstay of growth in 2018 with a total of 50 Mn+ online shoppers from these smaller cities Yearly Unique shoppers (Y-o-Y trends, MN) Y-o-Y Growth rates (%) Key takeaways Metro Tier-I Tier-II+ Metro: Total yearly shoppers • Slower growth in compared to Tier-I and Tier-II+ 75 90 120 • Added 3 Mn shoppers in 2017, expected to add 5 Mn more in 2018 50% Tier-I : 56 • Second fastest growing market 37 • Added 3 Mn shoppers in 2017, expected to add 6 Mn more in 2018 30% 27 23 17 Tier-II+ : 14 • Fastest growing market Industry added 10 Mn shoppers in 2017, expected to add 19 Mn more in 2018 • 41 36 15% 33 2016 2017 2018F | 7 Source: RedSeer analysis
Category wise growth rate Industry growth in 2017 was driven largely by Mobiles; FMCG was the fastest growing category GMV growth, % (Y-o-Y growth, CY 2016-17) GMV Share of Category, % Future prospects Growth is driven by bigger players like Amazon. With Amazon’s aggressive push on Pantry and new investments in this category by other player is expected to maintain high growth 6% 66% FMCG Growth is driven by Flipkart and Amazon. New internet users, reducing replacement cycles and supply side push through more and more exclusives are most likely to drive furtherhigh pace growth in 2018 50% 51% Mobiles Growth is driven by Flipkart and Amazon. Increasing adoption of high value categories like Large Appliances, Camera etc. combined with enhanced affordability due to No-cost EMI schemes etc. would drive further growth 17% 45% Other Electronics Growth is driven mainly by Amazon, Flipkart and vertical player. Large selection, increased reach, customer made products etc. are likely to further drive growth of the category in 2018 21% Home 5% Growth driven by Flipkart group, Amazon and Shopclues. Smaller verticals are struggling to grow. Growth potential is huge in 2018 with fashion as one of the preferred category for new shoppers. 17% 18% Fashion | 8 Source: RedSeer analysis
Income vs City tier breakup - GMV Amazon has a higher share of customers in high income groups; while Flipkart leads among Tier-1 and Tier-2 customers with lower income >10 lacs 5-10 lacs 2.5-5 lacs <2.5 lacs Total Market Share 38% 45% 17% 4% 2% 6% >10 lacs >10 lacs >10 lacs 21% 17% 25% 5-10 lacs 5-10 lacs 20% 5-10 lacs 25% 31% 2.5-5 lacs 61% 2.5-5 lacs 50% 2.5-5 lacs 39% <2.5 lacs <2.5 lacs <2.5 lacs Metro Tier-2 Tier-1 | Source: RedSeer analysis 9
Flexible in Approach, Firm on Results Flexible in Approach, Firm on Results Thank You! Mumbai Office: 25/b 4th Floor Usha Sadan Near Colaba PO, Colaba, Mumbai, India - 400005 Bengaluru Office: Indiqube Sigma, Plot 3/B, 7thC Main, 3rd Block Koramangala Bangalore, India - 560034 Delhi Office: Inhwa Business Centre Ground Floor, Iris Tech Park Sohna Road Gurgaon, India - 122002 Dubai Office: 42Seer Technologies FZE, G-D-Flex G089 C- Thub Dubai Silicon Oasis Dubai, UAE | © 2017 RedSeer Consulting Confidential and Proprietary Information www.redseerconsulting.com query@redseerconsulting.com