Download

1 / 5
0 likes | 3 Views
This interesting presentation reveals the top 10 TradingView indicators for a successful nifty intraday trading system in 2025. It is created for traders who are active and showcases RSI, MACD, and Supertrend with bright Nifty 50 chart illustrations. Every slide also contains detailed setups, practical notes, and risk management tactics. Interactive Polls and downloadable indicators settings give the audience the opportunity to engage. Aimed at newer day traders, trading workshop participants will learn to apply these indicators with confidence in fast moving markets. https://quantzee.com/

E N D
TOP 10 TRADINGVIEW INDICATORS FOR NIFTY INTRADAY TRADERS IN 2025 The Nifty index continues to be traders' darling in the fast-changing world of intraday trading because of its liquidity and volatility in the Indian market. And as we enter 2025, knowing how to trade this index well will boil down to using the best tools on platforms such as Trading View. This presentation looks at the top 10 signals that can refine your decision-making, improve your risk control and offer access to potential opportunities in price moves over the short-term. Integrating those TradingView indicators in your plan, you will be better positioned to develop a strong nifty trading intraday system and succeed in the changing market environment.
INDICATORS FOR TREND IDENTIFICATION • Moving Averages (MA): Smoothen price data to determine the trend direction. Very short term MAs (say 5 and 15 periods) will help you identify Nifty intraday trading algorithm. • Ichimoku Cloud: Offers traders an easy-to-understand, all-in-one indicator that suitable for fast markets. • Supertrend: Follows and indicates trends with dynamic stop-loss levels which is useful for allotting decent stop-loss values to intraday trades.
INDICATORS FOR MOMENTUM • RELATIVE STRENGTH INDEX (RSI): MEASURES THE SPEED OF PRICE CHANGES TO IDENTIFY OVERBOUGHT OR OVERSOLD CONDITIONS, HELPING TIME ENTRIES AND EXITS. • MACD: IT IS USED TO GAUGE MOMENTUM CHANGES BY KEEPING AN EYE ON MOVING AVERAGES, ITS HISTOGRAM SHOWS TREND STRENGTH. • STOCHASTIC: IDENTIFIES OVERBOUGHT AND OVERSOLD CANDLE RANGES, GENERATING NIFTY INTRADAY TRADING SIGNALS FOR POTENTIAL TREND REVERSALS AND CAPTURING SHIFTS IN MARKET VOLATILITY AND NIFTY PRICE MOMENTUM.
INDICATORS FOR VOLATILITY AND VOLUME • Bollinger Bands: Plots volatility by using moving average and standard deviation lines. Narrowing bands are usually a sign that a breakout is imminent. • Volume Profile: A nifty intraday trading tool that reveals the amount of trading at specific price levels, highlighting high-liquidity zones and key support/resistance areas. • VWAP: Measures the volume-weighted average price, used as a benchmark to compare the value of trades near the open and close. • Fibonacci Retracement: Identifies potential support and resistance levels to make intraday trding decisions.
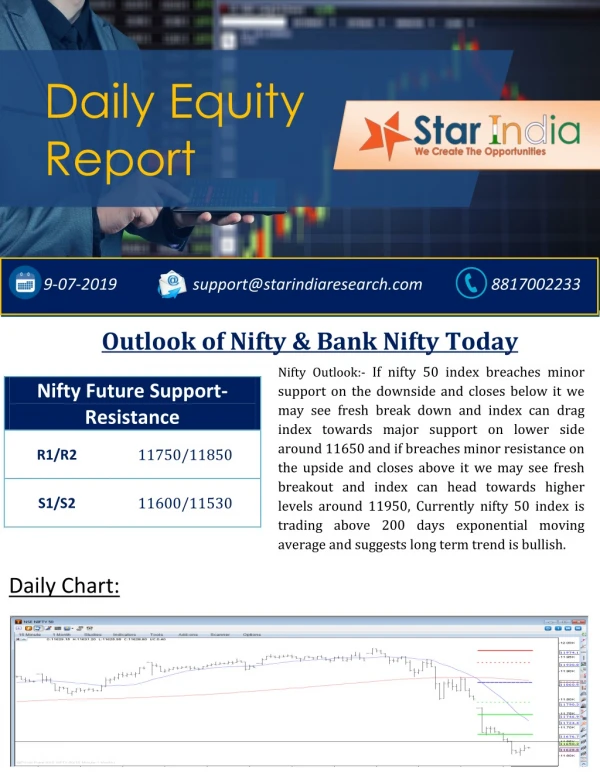
BUILDING YOUR TRADING SYSTEM AND CONCLUSIONO The focus of inifty trading intraday system is in assimilating these indicators into a strategy. Such as combination between Moving Averages to confirm trends along with RSI for timing, and Bollinger Bands to understand volatility will create a powerful nifty intraday trading system. Steps like backtesting and adjusting to the market are necessary to honing an edge! For additional high quality tools and resources to elevate your trading, check out https://quantzee.com.. Use these indicators to your advantage and you will be well on your way to profitable trading in 2025.