Download

1 / 47
470 likes | 482 Views
Low FD rates are likely to stay Here's what you can do.. by Chirag Mehta, Senior Fund Manager, Alternative Investments

E N D
Low FD rates are likely to stay – Here's what you can do. Speaker: Chirag Mehta, Senior Fund Manager, Alternative Investments May 14, 2021
2 Are low & falling FD rates bothering you? 14 SBI 1 year FD rate 12 Bank Bank FD interest FD interest rates rates 10 SBI 2.90% - 5.40% 2.50% - 5.50% 2.50% - 5.50% 2.50% - 5.75% 2.50% - 5.30% 8 HDFC 6 ICICI 4 Axis 2 Kotak Data as of May 10th2021 Source: Source: FD Interest Rates FD Interest Rates - - Compare Best Fixed Deposit Rate in India, Compare Best Fixed Deposit Rate in India, 10 10 May May 2021 2021 (myloancare.in) (myloancare.in). Bloomberg, SBI . Bloomberg, SBI
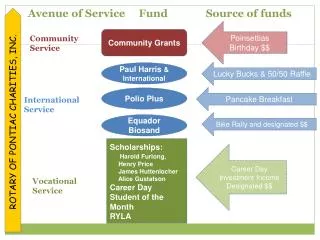
3 Despite low returns, bulk of money still in FDs 53% of household savings are kept in Bank deposits Source: Quarterly Estimates of Households’ Financial Assets and Liabilities, RBI, June 2020 Source: Quarterly Estimates of Households’ Financial Assets and Liabilities, RBI, June 2020
4 How efficient is india’s preferred saving instrument? Bank Fixed Deposit Pros: •Assured returns •Deposit Insurance •Loan against FD Bank Fixed Deposit Cons: •Low returns / low real returns •Insured upto 5 lacs •Liquidity – penalty on premature withdrawal •Taxation as per tax slab
FD is a long term losing proposition 1990* 1990* 2000 2000 2010 2010 2015 2015 2020 2020 CAGR CAGR Consumer Basket Consumer Basket TOTAL SPENDING PER ANNUM 23,759 68,923 151,279 280,064 427,619 10.1% Price of gold, INR/10 grams 3,409 4,528 18,268 26,335 50,104 9.4% Units ( Grams) of gold to consume my basket 70 152 83 106 85 BSE SENSEX 730 4,659 15,585 26,557 47,751 14.9% Units of BSE-30 Index to consume my basket 33 15 10 11 9 Fixed Deposit Basket Index Value (Value of initial investment Jan 1, 1990 =1000) (SBI 1 Year Deposit Rate)* 1,064 2,220 3,550 4,628 5,814 6.0% Units of FD Basket to consume my basket 22 31 43 61 73 Past Past performance may or may not sustained in future performance may or may not sustained in future Quarterly compounding and Tax rate on Fixed Deposit assumed to be 30 compounding and Tax rate on Fixed Deposit assumed to be 30% Quarterly %
Other Assets have better return options, should you opt for them?
7 Other assets have done well but it’s a challenge to pick winners amidst volatility There have been years when equity markets had a brilliant run, years when only bonds were dependable, and years when gold shined the brightest, and these periods did not typically overlap 2006 2006 2007 2007 2008 2008 2009 2009 2010 2010 2011 2011 2012 2012 2013 2013 2014 2014 2015 2015 2016 2016 2017 2017 2018 2018 2019 2019 2020 2020 2021* 2021* Sense Sense x 49% x 49% Sense Sense x 49% x 49% Gold Gold 26% 26% Sense Sense x 83% x 83% Gold Gold 23% 23% Gold Gold 32% 32% Sense Sense x 28% x 28% Sense Sense x 11% x 11% Sense Sense x 32% x 32% Bonds Bonds 9% 9% Bonds Bonds 13% 13% Sense Sense x 30% x 30% Gold Gold 8% 8% Gold Gold 16% 16% Gold Gold 28% 28% Sensex Sensex 2% 2% Gold Gold 20% 20% Gold Gold 16% 16% Bonds Bonds 9% 9% Gold Gold 24% 24% Sense Sense x 19% x 19% Bonds Bonds 7% 7% Gold Gold 12% 12% Bonds Bonds 4% 4% Bonds Bonds 14% 14% Sensex Sensex - -4% 4% Gold Gold 11% 11% Gold Gold 5% 5% Sensex Sensex 7% 7% Sensex Sensex 14% 14% Sensex Sensex 17% 17% Bonds Bonds 0.3% 0.3% Sense Sense x x - -52% 52% Sense Sense x x - -24% 24% Bonds Bonds 4% 4% Bonds Bonds 7% 7% Bonds Bonds 4% 4% Bonds Bonds 5% 5% Bonds Bonds 9% 9% Gold Gold - -5% 5% Gold Gold - -8% 8% Gold Gold - -7% 7% Sense Sense x 3% x 3% Bonds Bonds 5% 5% Bonds Bonds 6% 6% Bonds Bonds 11% 11% Bonds Bonds 12% 12% Gold Gold - -5% 5% Past performance may or may not sustained in future Past performance may or may not sustained in future calendar year from top to bottom The chart ranks the best to worst performing indexes per The chart ranks the best to worst performing indexes per calendar year from top to bottom *Data as of April 2021 *Data as of April 2021 Past performance may or may not be sustained in future. Past performance may or may not be sustained in future. Based on S&P BSE Sensex; Domestic Gold prices and Based on S&P BSE Sensex; Domestic Gold prices and CRISIL Composite Bond Fund Index CRISIL Composite Bond Fund Index Imagine someone holding an all equity portfolio in 2008, or holding none in the equity rally that followed? Source: Bloomberg Source: Bloomberg
8 Asset markets go through cycles of optimism & pessimism Equity -18% 4% 73% 13% 42% 47% 47% -52% 81% 17% -25% 26% 9% 30% -4% 3% 30% 7% 14% 17% Debt 35% 29% 8% 0% 5% 4% 7% 9% 4% 5% 7% 9% 4% 14% 9% 13% 5% 6% 11% 12% Gold 6% 24% 14% 1% 22% 21% 17% 30% 20% 24% 32% 10% -19% 1% -7% 11% 5% 8% 16% 28% 2001 2002 2003 2004 2005 2006 2007 2008 2009 2010 2011 2012 2013 2014 2015 2016 2017 2018 2019 2020 Debt Rally Equity Rally Gold Rally Equity Rally Debt Rally Equity Rally Gold Rally Note Note: Past performance may or may not be sustained in future. : Past performance may or may not be sustained in future.
9 Global markets are dynamic & full of surprises - some predictable some not! • 1994: the Harshad Mehta scam, • 1995: the Mexico tequila crisis and the collapse of Emerging Markets, • 1997; the Asian crisis and the collapse of Emerging Markets, • 1998: the bankruptcy of Russia and hedge fund Long Term Capital Management, • 2000: the collapse of the tech bubble, • 2001: 9/11 and the bankruptcy of Unit Trust of India, • 2003: SARS, the Iraq war • 2008: the bankruptcy of Lehman, the Global Financial Crisis • 2013: Bernanke's twist led to India's collapse • 2016: Demonetization and the Great Indian Economic Slowdown • 2018: bankruptcy of IL&FS • 2019: Cooperative banks and developers going bust, • 2020: YES Bank, COVID-19
Is there a market linked liquid option to Is there a market linked liquid option to FD’s? FD’s?
11 Options to FDs – What are we looking for? Market linked Returns Lower volatility Better predictability Lower Downside
12 Combine asset classes to deliver a better risk adjusted returns If you compound your money at 12% per year you are better off than an investor who makes 25% in one year and loses 20% in the next Risk-Return Equity +Debt +Gold * Equity + Debt ** Equity Debt Gold 11.05% 11.00% 12.53% 7.24% 11.41% CAGR 9.41% 13.53% 22.15% 3.29% 17.37% Annualized SD -15.53% -22.32% -36.55% -5.43% -28.67% VAR -21.43% -36.08% -56.17% -6.29% -25.22% Maximum Drawdown 0.5332 0.3674 0.2936 Sharpe Ratio 0.3662 0.3094 Time frame is November 2004 to April 2021. The period is taken from 2004 since the asset allocation weights are calculated based on normalizing the historical monthly equity and debt indicators. Given the normalization time frame used in the strategy, data availability for certain parameters beyond the time frame analyzed was a constraint. Compiled by Quantum AMC *Equity-Debt-Gold in ratio of 40-40-20. **Equity-Debt allocated in 60-40 range Based on Sensex TRI, Crisil Composite Bond fund index, and Domestic Gold Prices Note: Past performance may or may not be sustained in the Note: Past performance may or may not be sustained in the future The most diversified strategy yields similar returns with the lower volatility, compared to a pure equity strategy future
13 Each asset serves a role in a portfolio context GOLD Diversifies against macro events and a store of value FIXED INCOME Regular income and stability EQUITY Long term growth
Good prices & good news do not come at the same time Equity allocation Sensex TRI 65.00% 75000 60.00% 60000 55.00% 50.00% 45000 45.00% 30000 40.00% 35.00% 15000 30.00% 25.00% 0 Dec-12 Dec-13 Dec-14 Dec-15 Dec-16 Dec-17 Dec-18 Dec-19 Dec-20 Aug-12 Jun-13 Aug-13 Jun-14 Aug-14 Jun-15 Aug-15 Jun-16 Aug-16 Jun-17 Aug-17 Jun-18 Aug-18 Jun-19 Aug-19 Jun-20 Aug-20 Oct-12 Oct-13 Oct-14 Oct-15 Oct-16 Oct-17 Oct-18 Oct-19 Oct-20 Feb-13 Apr-13 Feb-14 Apr-14 Feb-15 Apr-15 Feb-16 Apr-16 Feb-17 Apr-17 Feb-18 Apr-18 Feb-19 Apr-19 Feb-20 Apr-20 Feb-21 Apr-21 Data as of Data as of April 2021; April 2021; Source: Quantum MF Note: Past performance may or may not be sustained in future. Note: Past performance may or may not be sustained in future. Source: Quantum MF
Performance of Quantum Multi Asset Fund of Funds Direct Plan – Growth Option The Scheme is co-managed by Mr. Chirag Mehta and Mr. Nilesh Shetty since July 11, 2012. Current Value of 10,000 Current Value of 10,000 Invested Invested at the beginning of a given at the beginning of a given period period Period Period Benchmark Benchmark Returns Returns (%)# (%)# Benchmark Benchmark ( (Rs Rs)# S&P BSE S&P BSE Sensex TRI Sensex TRI ( (Rs Rs.) .) Scheme Scheme Returns (%) Returns (%) 0 0 S&P BSE S&P BSE Sensex TRI Sensex TRI Returns (%) Returns (%) Scheme Scheme ( (Rs Rs) ) )# 1 year 11,600 12,001 14,626 16.00% 20.01% 46.26% 3 years 12,795 13,863 14,377 8.55% 11.49% 12.85% 5 years 15,544 17,026 20,260 9.21% 11.22% 15.15% 7 years 18,596 20,175 23,874 9.26% 10.54% 13.23% Since Inception (11th July 2012) 22,254 23,944 31,329 9.50% 10.42% 13.84% Past performance may or may not be sustained in the future Past performance may or may not be sustained in the future. Load is not taken into consideration in scheme returns calculation. Data Different Plans shall have different expense structure. Returns are calculated on the basis of Compounded Annualized Growth Rate (CAGR). # The benchmark of the scheme has been changed w.e.f. April 01, 2021. Earlier benchmark was CRISIL Composite Bond Fund Index (40%) + S&P BSE SENSEX Total Return Index (40%) + Domestic price of Gold (20%). It is a customized index and it is rebalanced daily. For performance of other Schemes Managed by Mr. Chirag Mehta please see slide number 39 and 40 and for performance of other Schemes Managed by Mr. Nilesh Shetty please see slide number 38. Data as of as of 30 30th thApril April 2021 2021
16 90% of the time, you would have been better off than a FD Quantum Multi Asset Fund of Funds 250 Total Days: 3215 Down Days: 336 Down Days %: 10.45 SBI 1 year deposit 240 230 CRISIL Composite Bond Fund Index (20%) + S&P BSE Total Return Index (40%) + CRISIL Liquid Index(25%) + Domestic price of Gold (15%) 220 210 200 190 N N A A V V 180 Returns since inception: 9.50% Standard Deviation : 5.99% (Annulised since inception) 170 160 150 140 130 120 110 ( (Base = Base = 100 100, , as on as on 11 11th July th July 2012 2012) ) 100 90 11-Jul-12 30-Apr-21 Period Period Past performance may or may not be sustained in Past performance may or may not be sustained in future. only and not a recommendation to invest. Investments in Quantum Multi Asset Fund of Funds / mutual funds should not be construed as a promise, guarantee on or a forecast of any minimum returns. Unlike fixed deposit with Banks there is no capital protection guarantee or assurance of any return in Quantum Multi Asset Fund of Funds / mutual funds investment. Investment in Quantum Multi Asset Fund of Funds as compared to Fixed Deposits carry moderately high risk, different tax treatment and subject to market risk and any investment decision needs to be taken only after consulting the Tax future. The comparison with Fixed Deposits has been given for the purpose of the general information Consultant or Financial Advisor. Source – Bloomberg, Quantum AMC
17 84% of the time, you would have been better off on a 3-Year rolling basis QMAFOF 3 years rolling returns Total Days: 2120 Down Days : 336 Down Days %: 15.85 16% SBI FD 3 years rolling returns CRISIL Composite Bond Fund Index (20%) + S&P BSE Total Return Index (40%) + CRISIL Liquid Index(25%) + Domestic price of Gold (15%) 3 years rolling returns 14% 12% 10% 8% 6% 4% 2% 0% November… November… November… November… November… November… Septembe… Septembe… Septembe… Septembe… Septembe… Septembe… February,… February,… February,… February,… February,… February,… December,… December,… December,… December,… December,… December,… June, 16 June, 17 June, 18 June, 19 June, 20 April, 16 April, 17 April, 18 April, 19 April, 20 April, 21 July, 15 March, 16 May, 16 July, 16 March, 17 May, 17 July, 17 March, 18 May, 18 July, 18 March, 19 May, 19 July, 19 March, 20 May, 20 July, 20 March, 21 January, 16 January, 17 January, 18 January, 19 January, 20 January, 21 August, 15 October, 15 August, 16 October, 16 August, 17 October, 17 August, 18 October, 18 August, 19 October, 19 August, 20 October, 20 Past performance may or may not be sustained in Past performance may or may not be sustained in future. recommendation to invest. Investments in Quantum Multi Asset Fund of Funds / mutual funds should not be construed as a promise, guarantee on or a forecast of any minimum returns. Unlike fixed deposit with Banks there is no capital protection guarantee or assurance of any return in Quantum Multi Asset Fund of Funds / mutual funds investment. Investment in Quantum Multi Asset Fund of Funds as compared to Fixed Deposits carry moderately high risk, different tax treatment and subject to market risk and any investment decision needs to be taken only after consulting the Tax Consultant or Financial Advisor. Source – Bloomberg, Quantum AMC future. The comparison with Fixed Deposits has been given for the purpose of the general information only and not a
18 There isn’t a single 3 year period since QMAF’s inception when it posted a negative return QMAF 3 year rolling returns as of April 2021 Minimum Minimum Return Return Maximum Maximum Return Return 1.54% 13.63% Average Average Return Return 8.76%
Asset class performance and Quantum Multi Asset Fund of Funds The performance shown in the graph should be reviewed in conjunction with detailed performance of the scheme provided on slide number 15, Time Period: July 11,2012 to 30 30th thApril April 2021. Note Note: Past performance may or may not be sustained in future. : Past performance may or may not be sustained in future.
Asset Class Outlook Asset Class Outlook
Equity Equity
India’s economic growth reflected in corporate earnings Source: % change in INR, CLSA and Bloomberg Finance L.P., as of January 31, 2021. Source: % change in INR, CLSA and Bloomberg Finance L.P., as of January 31, 2021. CY 21 and CY 22 are estimate numbers. CY 21 and CY 22 are estimate numbers.
Spiking PER overstates valuation given the june quarter’s gap down Source: Bloomberg Finance L.P., Source: Bloomberg Finance L.P., as March, 2020 Past Performance may or may not be sustained in future. Past Performance may or may not be sustained in future. as March, 2020
Fixed Income Fixed Income
Higher fiscal deficit will keep government debt elevated Fiscal Deficit Fiscal Deficit 14% 12% 10% 8% % of GDP % of GDP 6% 4% 2% 0% FY 14 FY 15 FY 16 FY 17 Centre FY 18 FY 19 State FY 20 FY 21 E FY 22 E Source: Source: CMIE, Quantum Research FY21 and FY22 Fiscal Deficit numbers are as per Quantum Estimates
RBI is committed to remain accommodative for longer RBI's Bond Purchases 6,000 8.0% 5,000 4,000 6.0% 3,000 2,000 4.0% 1,000 INR Billion - -1,000 2.0% -2,000 FY14 FY15 FY16 FY17 FY18 FY19 FY20 FY21 Gross Purchase Net Purchase Repo Rate Source Source – – MOSPI, MOSPI, Bloomberg, Bloomberg, Quantum Quantum Research Research Source: Source: RBI, Bloomberg, Quantum Research RBI, Bloomberg, Quantum Research
Higher inflation is on the way 8.0% 6.0% 4.0% 2.0% CORE CPI Source: Source: CMIE, Quantum Research FY21 and FY22 Fiscal Deficit numbers are as per Quantum Estimates
Gold Gold
Gold is a Monetary Asset – Gold has kept up with money supply growth 1600 1400 US Money Supply - M2 Gold Prices 1200 1000 800 600 400 200 Rebased = 100 0 1974 1977 1981 1985 1989 1993 1997 2001 2005 2009 2013 2017 2021 Data as of Data as of April April 2021 Source: Fred Source: Fred 2021 Past performance may or may not sustained in Past performance may or may not sustained in future future
Negative rates make holding gold more attractive Lack of yield on fiat currencies supports gold 2250 12 2000 10 1750 8 1500 6 1250 4 USD % 1000 2 750 0 500 -2 250 -4 0 1970 -6 1975 1980 1985 1990 1995 2000 2005 2010 2015 2020 Gold price US Real interest rate Data as of Data as of April Source: Source: Bloomberg Bloomberg April 2021 2021 Past Performance may or may not be sustained in future. Past Performance may or may not be sustained in future.
Asset allocation should be Unbiased, Dynamic & Agile
Dynamic asset allocation …Research backed process and discipline Ideal asset allocation is not static. Asset allocation needs to change depending on an asset class’s relative performance vis-à-vis other asset class. The fund follows dynamic portfolio allocation technique Asset Class Allocation (% of net Assets) Equity 26.02% 56.74% 15.25% 1.99% Fixed Income Gold Cash (Net) Portfolio allocation between the units of equity, debt/ money markets and gold schemes broadly depends on the relative valuations between the asset classes Allocation (% of net Allocation (% of net Assets) Assets) Scheme Scheme Relative valuations are determined by evaluation of various influencing factors: Quantum Long Term Equity Value Fund Quantum Nifty Fund (ETF) Quantum Liquid Fund Quantum Dynamic Bond Fund Quantum Gold Fund (ETF) Quantum India Esg Equity Fund 13.12% 10.17% 43.02% Price/Earnings Ratio relative to historical averages; • 13.72% The relationship between Earnings Yield to Bond Yield relative to historical averages; • 15.25% 2.73% Macroeconomic factors prevailing globally, and within India • Data as of April 2021 Data as of April 2021
Unbiased asset allocation.. Not biased to any particular asset class.. Invests across asset classes : Equity, Debt and Gold Diversification across asset classes and within asset classes by investments is done through schemes of Quantum mutual fund Asset class Range of Exposure Fund Quantum Long Term Equity Value Fund, Quantum Nifty ETF, Quantum India ESG Equity Fund Quantum Liquid Fund, Quantum Dynamic Bond Fund Equity 25-65% Debt 25-65% Quantum Gold Fund (ETF) Gold 10-20%
Agile asset allocation.. Equity allocation Sensex TRI 65.00% 75000 60.00% 60000 55.00% 50.00% 45000 45.00% 30000 40.00% 35.00% 15000 30.00% 25.00% 0 Dec-12 Dec-13 Dec-14 Dec-15 Dec-16 Dec-17 Dec-18 Dec-19 Dec-20 Aug-12 Jun-13 Aug-13 Jun-14 Aug-14 Jun-15 Aug-15 Jun-16 Aug-16 Jun-17 Aug-17 Jun-18 Aug-18 Jun-19 Aug-19 Jun-20 Aug-20 Oct-12 Oct-13 Oct-14 Oct-15 Oct-16 Oct-17 Oct-18 Oct-19 Oct-20 Feb-13 Apr-13 Feb-14 Apr-14 Feb-15 Apr-15 Feb-16 Apr-16 Feb-17 Apr-17 Feb-18 Apr-18 Feb-19 Apr-19 Feb-20 Apr-20 Feb-21 Apr-21 Data as of Data as of April 2021; April 2021; Source: Quantum MF Note: Past performance may or may not be sustained in future. Note: Past performance may or may not be sustained in future. Source: Quantum MF
35 Consider an option of Quantum Multi Asset Fund before you book your next FD Diversifies across asset classes – which mitigates risk inherent of a particular asset class and provides steady returns Reduces dependency on a single asset class to generate returns No need to time markets. Invest in peace – the Fund manager strategically positions the portfolio to generate optimal returns while watching risks Follows regular rebalancing approach within each asset class which allows investors to “buy-low sell-high” Better and a more tax efficient option for investors who park their money in long term FDs (3 years and above) Aims at reducing volatility of returns Note: Unlike Fixed Deposit with Banks there is no capital protection guarantee or assurance of any return in Quantum Multi Asset Fund. Investments in Quantum Multi Asset Fund as compared to Fixed Deposit carry “moderately” high risk and is subject to market risk
37 Make a prudent choice! It’s time you reconsider your FD which may be a losing proportion in terms of inflation and make way for a multi asset allocation strategy option which has the potential to provide a boost of long term risk adjusted returns with measured equity allocations while minimizing downside risk from the debt and gold allocations..
Other Schemes managed by Nilesh Shetty Quantum Long Term Equity Value Fund Quantum Long Term Equity Value Fund Mr. Sorbh Gupta effective from December 1, 2020.Co-managing with Mr. Nilesh Shetty effective from March 28, 2011 Period Period 1 year Benchmark Returns (%) # Quantum Long Term Equity Value Fund–Direct Plan (Gr) Quantum Long Term Equity Value Fund–Regular Plan (Gr) Past performance may or may not be sustained in the future. Past performance may or may not be sustained in the future. Load is not taken into consideration in Scheme Return Calculation. Data #BSE 200 TRI. Returns are net of total expenses and are calculated on the basis of Compounded Annualized Growth Rate (CAGR). Different Plans shall have different expense structure. Mr. Sorbh Gupta & Mr. Nilesh Shetty manages 2 schemes of Quantum Mutual Fund. 3 years 5 years Scheme Returns (%) Scheme Returns (%) Benchmark Returns (%) # Scheme Returns (%) Benchmark Returns (%) # 57.24% 53.92% 7.82% 11.46% 11.17% 15.09% 56.46% 53.92% 7.39% 11.46% NA NA Data as of as of 30 30th thApril April ,2021 ,2021
Other Schemes managed by Mr. Chirag Mehta Quantum Gold Fund Quantum Gold Fund Mr. Chirag Mehta is managing the scheme effective from May 1, 2009. Ms. Ghazal Jain is co-managing the scheme effective from June 2, 2020 Period Period 1 year Benchmark Returns (%) # 3 years 5 years Scheme Returns (%) Scheme Returns (%) Benchmark Returns (%) # Scheme Returns (%) Benchmark Returns (%) # Quantum Gold Fund (Gr) -1.17% -0.37% 13.37% 14.44% 7.89% 8.94% Past performance may or may not be sustained in the future. Past performance may or may not be sustained in the future. # Domestic Price of Gold. Data Data as as of of 30 30th thApril April , ,2021 2021 Returns are net of total expenses and are calculated on the basis of Compounded Annualized Growth Rate (CAGR). Mr. Chirag Mehta manages 5 Schemes and Ms. Ghazal Jain manages 2 Schemes of the Quantum Mutual Fund. The Scheme being Exchange Traded Fund has one plan to invest through stock exchange and having a single expense structure Quantum Gold Savings Fund Quantum Gold Savings Fund Mr. Chirag Mehta is managing the scheme effective from May 19, 2011. Ms. Ghazal Jain is co-managing the scheme effective from June 2, 2020 Period Period 1 year 3 years 5 years Benchmark Returns (%) # Benchmark Returns (%) # Scheme Returns (%) Scheme Returns (%) Benchmark Returns (%) # Scheme Returns (%) Quantum Gold Savings Fund– Direct Plan (Gr) Quantum Gold Savings Fund– Regular Plan (Gr) -3.38% -0.37% 13.17% 14.44% 8.19% 8.94% -3.46% -0.37% 13.05% 14.44% NA NA Past performance may or may not be sustained in the future. Past performance may or may not be sustained in the future. # Domestic Price of Gold. Data Returns are net of total expenses and are calculated on the basis of Compounded Annualized Growth Rate (CAGR). Different Plans shall have different expense structure. Mr. Chirag Mehta manages 5 Schemes and Ms. Ghazal Jain manages 2 Schemes of the Quantum Mutual Fund. Data as as of of 30 30th thApril April 2021 2021
Other Schemes managed by Mr. Chirag Mehta Quantum India ESG Equity Fund Quantum India ESG Equity Fund Mr. Chirag Mehta effective from July 12, 2019.Co-managing with Ms. Sneha Joshi effective from July 12, 2019 Period Period 1 year 3 years 5 years Scheme Returns (%) Benchmark Returns (%) # Scheme Returns (%) Benchmark Returns (%) # Scheme Returns (%) Benchmark Returns (%) # Quantum India ESG Equity Fund – Direct Plan (Gr) Quantum India ESG Equity Fund – Regular Plan (Gr) 61.20% 54.08% NA NA NA NA 60.13% 54.08% NA NA NA NA Past performance may or may not be sustained in the future. Data as on of of 30 30th thApril April , ,2021 2021 Different Plans shall have different expense structure. Returns are net of total expenses and are calculated on the basis of Compounded Annualized Growth Rate (CAGR). Mr. Chirag Mehta manages 5 Schemes and Ms. Sneha Joshi 1 Schemes of the Quantum Mutual Fund. # NIFTY 100 ESG TRI. Quantum Equity Fund of Funds Quantum Equity Fund of Funds Mr. Chirag Mehta is the Fund Manager effective from November 01, 2013. Period Period 1 year 3 years 5 years Benchmark Returns (%) # Benchmark Returns (%) # Scheme Returns (%) Scheme Returns (%) Benchmark Returns (%) # Scheme Returns (%) Quantum Equity Fund of Funds – Direct Plan (Gr) Quantum Equity Fund of Funds – Regular Plan (Gr) 47.42% 53.92% 8.30% 11.46% 12.83% 15.09% 47.06% 53.92% 8.09% 11.46% NA NA Past performance may or may not be sustained in the future. Data as on of of 30 30th thApril April , ,2021 2021. Load is not taken into consideration in Scheme Return Calculation. #BSE 200 TRI Returns are net of total expenses and are calculated on the basis of Compounded Annualized Growth Rate (CAGR). Different Plans shall have different expense structure. Mr. Chirag Mehta manages 5 schemes of the Quantum Mutual Fund.
Disclaimer – Terms of Use The data in this presentation are meant for general reading purpose only and are not meant to serve as a professional guide/investment advice for the readers. This presentation has been prepared on the basis of publicly available information, internally developed data and other sources believed to be reliable. Whilst no action has been suggested or offered based upon the information provided herein, due care has been taken to endeavor that the facts are accurate and reasonable as on date. Quantum AMC shall make modifications and alterations to the performance and related data from time to time as may be required as per SEBI Mutual Fund Regulations. Readers are advised to seek independent professional advice and arrive at an informed investment decision before making any investment. None of the Sponsors, the Investment Manager, the Trustee, their respective Directors, Employees, Affiliates or Representatives shall be liable for any direct, indirect, special, incidental, consequential, punitive or exemplary damages, including lost profits arising in any way from the data/information/opinions contained in this presentation. The Quantum AMC shall make modifications and alterations to the performance and related data from time to time as may be required. Please Please visit a guaranteed or assured rate of return and there can be no assurance that the schemes objective will be achieved and the NAV of the scheme may go up and down depending upon the factors and forces affecting securities market. Investment in mutual fund units involves investment risk such as trading volumes, settlement risk, liquidity risk, default risk including possible loss of capital. Past performance of the sponsor / AMC / Mutual Fund does not indicate the future performance of the Scheme. Statutory Details: Quantum Mutual Fund (the Fund) has been constituted as a Trust under the Indian Trusts Act, 1882. Sponsor: Quantum Advisors Private Limited. (liability of Sponsor limited to Rs. 1,00,000/-). Trustee: Quantum Trustee Company Private Limited. Investment Manager: Quantum Asset Management Company Private Limited. The Sponsor, Trustee and Investment Manager are incorporated under the Companies Act, 1956. visit – www.QuantumMF.com to read scheme specific risk factors. Investors in the Scheme are not being offered 14 14th Mutual fund investments are subject to market risks, read all scheme related documents carefully Mutual fund investments are subject to market risks, read all scheme related documents carefully. . thMay 2021 May 2021
Thank You 47