The UBC Geophysical Inversion Facility
The UBC Geophysical Inversion Facility. EM geophysics for hydrocarbons: Inversion applications and current research at UBC-GIF. Scott Napier Doug Oldenburg Jamin Cristall. May 2005. http://www.eos.ubc.ca/ubcgif. Acknowledgments. This research was sponsored by NSERC and:. AGIP

The UBC Geophysical Inversion Facility
E N D
Presentation Transcript
The UBCGeophysical Inversion Facility EM geophysics for hydrocarbons: Inversion applications and current research at UBC-GIF Scott Napier Doug Oldenburg Jamin Cristall May 2005 http://www.eos.ubc.ca/ubcgif
Acknowledgments This research was sponsored by NSERC and: • AGIP • Anglo American • BHP Billiton • EMI • Falconbridge • INCO • Kennecott • MIM • Muskox Minerals • Newmont • Placer Dome • Teck Cominco Thanks to UBC-GIF personnel: • Colin Farquharson • Eldad Haber • Roman Shekhtman http://www.eos.ubc.ca/ubcgif
Outline • Electrical conductivity and hydrocarbons • Introduction to forward modelling • Introduction to inversion methodology • Case Studies • Shallow gas • Oil sands • Current research • Marine CSEM • Conclusions
DC Resistivity Electrical conductivity and hydrocarbons GR/SP Resistivity FDEM Med Deep SP TEM GR • Can we detect hydrocarbons with EM measurements at the surface? Marine CSEM • Hydrocarbons are resistive • Measurements of ρ are common in the borehole 0.2 Ωm 2000 Ωm
Outline • Electrical conductivity and hydrocarbons • Introduction to forward modelling • Introduction to inversion methodology • Case Studies • Shallow gas • Oil sands • Current research • Marine CSEM • Conclusions
Forward Modelling: The airborne FDEM survey Waveform: Frequency domain I Time Recorded Data: Amplitude and Phase or Real and Imaginary parts Boundary conditions at z =
Forward Modelling EM data in 1D: • The EM skin depth • Divide the earth into stack of layers • fixed thickness • constant internal conductivity F[m] Tx Rx z1 z2 z3 . . Basement half-space zn 5 frequencies from 385Hz to 102kHz with real and imaginary parts
Outline • Electrical conductivity and hydrocarbons • Introduction to EM methods • Introduction to inversion methodology • Case Studies • Shallow gas • Oil sands • Current research • Marine CSEM • Conclusions
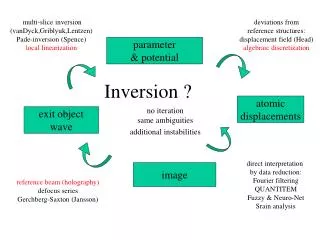
The inverse problem: Unconstrained Optimization F-1 ? • Geophysical data are: F[m] + = d • m: model --- unknown • F: forward mapping operator • : errors • d: observations (data) • Given: • data, errors, a forward modelling method • Find: • the model that generated measurements. • Major Difficulty: Non-uniqueness d
Inversion as an optimization problem • Define • Model objective function. • Misfit function. • Minimize = d + m Subject to d < Tol. : Regularization parameter : Observed data : Model and Reference model Wd,W : Data error, model weighting
Minimizing the Model Objective Objective function Differentiate where sensitivity matrix
Gauss-Newton method • Iterate Linearize F[m+m] = F[m] + J m • Update the model mk+1=mk + α(δm) • Repeat until convergence
Outline • Electrical conductivity and hydrocarbons • Introduction to EM methods • Introduction to inversion methodology • Case Studies • Shallow gas • Oil sands • Current research • Marine CSEM • Conclusions
Case Study: EM methods for shallow gas exploration in NW Alberta
gas well: 07-25-110-4W6 -Clay till with recent narrow gravel channels -Quaternary Lacustrine clays -Oligocene/Miocene braided river channels, gas or water charged -Cretaceous shale with possible deeply incised gravel/sand channels -Cretaceous shale Sand / Gravel/ Conglomerate Glacial Till Clays Shallow Gas: Geologic Background ~ 10 m < 5 m ~ 100-200 < 5 m 100-1000 m water or gas charged
Proof of Concept: Surveys over existing shallow gas field • Airborne frequency domain EM (FEM) • 2D DC resistivity
FDEM: • Advantages • Covers large areas at low cost • low ecological impact • 3d images from densely sampled data • Disadvantages • Inductive method • Not particularly sensitive to resistors • Shallow depth of investigation (maximum 100-150m)
FDEM Inversion: results data 5 20 Ωm 200
FDEM: Result • Gas saturated areas are detectable with FDEM data • Forward modelling indicates resistivity will be underestimated • gas field could have benefited from this survey depth = 46 m
DC Resistivity: • Advantages • galvanic method • sensitivity to resistors • good depth of investigation • Wenner Array • a spacing maximum 400m • Disadvantages • Ground based • slower more expensive acquisition • 2D interpretation • Data quality based on good electrical contact with ground • Suffers in swampy terrain • Difficult to penetrate conductive layers
DC resistivity: Result Observed Data Predicted Data Recovered Model 0 5400
Comparing results: • Challenging environment for DC resistivity surveying 0 5400
Western Canada Oil Sands Regions Athabasca Peace River Fort Peace River McMurray Wabasca Cold Lake Edmonton Calgary • Source: Mark Savage, “Oil Sands Characteristics - Geology,” 9 April 2002
The McMurray Formation Source: David R. Taylor, “McMurray Fm. Geological Model,” 28 May 2003
Airborne Time Domain EM Surveying: The GEOTEM system Waveform: Time Domain Inverted Data: Time Domain dB/dt I Time Time
Time Domain EM: The GEOTEM system • Advantages • No primary field during recording stage • secondary fields only • Depth of investigation • (maximum 150-250 m) • Large areas at low cost • low environmental impact • Disadvantages • Inductive method • not particularly sensitive to resistors
Inversion of Field Data 7 km 10 km
Comparison to Conductivity-Depth Transform m Inversion m CDT
Outline • Electrical conductivity and hydrocarbons • Introduction to EM methods • Introduction to inversion methodology • Case Studies • Shallow gas • Oil sands • Current research • Marine CSEM • Conclusions
Introduction: The marine CSEM survey • Towed Transmitter • horizontal electric dipole • Seafloor Receivers • record Ex , Ey • possible to record Ez , Hx and Hy
Why Marine CSEM? • Reduce risk for expensive deep water wells • Recover reservoir resistivity • Recover reservoir geometry • Why might it work? • Galvanic source • sensitive to resistors • Seawater provides shielding from EM noise sources • can detect signals of extremely low amplitude
Forward Modelling: Theory • FD Maxwell’s equations (e-it ) • Boundary condition
3D Forward Modelling: Introduction • A Helmholtz decomposition with Coulomb gauge • System equations for A and where • Discretize on a staggered grid
Forward Modelling: Response of a large reservoir Tx 0.3 Ωm 1150 m 6 km 1 Ωm 850 m 100 m 50 Ωm Amplitude of E-field (1 Hz) Reservoir -11 10 No Reservoir -12 10 -13 10 |E| [V/m] -14 10 -15 10 -16 10 0 1 2 3 4 5 6 7 8 Offset [km]
Forward Modelling: The Reservoir Model σ (S/m) profile view plan view 1650m depth • 1000 m • 600 m • 100 m • 2000 m • Key model parameters • water depth • depth of burial • thickness • horizontal extent • Transmitter parameters • orientated in x direction • 100 m long • 300m east of center of the reservoir
Forward Modelling: Reciprocity I V V I • Reciprocity solves this problem A B M N A B M N • Practical surveys consist of few Rx and many Tx • Each Tx requires a separate forward model • time consuming processing 20000 20000 13000 13000 20000 20000
Forward Modelling: Ex and Ey Real Ex Real Ey Imag Ex Imag Ey
Inversion: Results - 2 frequencies (1Hz & 5Hz) σ (S/m) z=-1600 m Z= -1500 m Isosurface at 0.2 S/m Recovered z=-1600 m Isosurface at 0.2 S/m True
Conclusion: • Frequency Domain EM, DC resistivity inversions could be very important • in exploration • in production 0 5400
Conclusion: m Source: David R. Taylor, “McMurray Fm. Geological Model,” 28 May 2003 • Airborne TEM in conjunction with an inversion code can clearly locate oil sand channels • Oil sands are a growing proportion of Canada’s hydrocarbon production
Conclusion: • Marine CSEM can significantly reduce risk in expensive offshore exploration • Potential to help define reservoir geometry