Download
1 / 141
1.41k likes | 1.67k Views
Planning for total gridlock: a LOWER white paper. Executive Summary: 1. Transit in the DC Area handles an insignificant amount of transport demand but will receive the majority of money in the next quarter century. This misallocation must be changed.

E N D
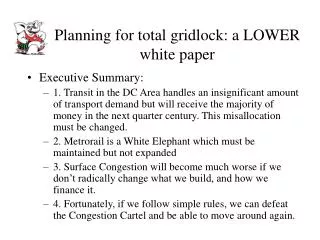
Planning for total gridlock: a LOWER white paper • Executive Summary: • 1. Transit in the DC Area handles an insignificant amount of transport demand but will receive the majority of money in the next quarter century. This misallocation must be changed. • 2. Metrorail is a White Elephant which must be maintained but not expanded • 3. Surface Congestion will become much worse if we don’t radically change what we build, and how we finance it. • 4. Fortunately, if we follow simple rules, we can defeat the Congestion Cartel and be able to move around again.
LOWER’s role in the Transportation Planning Process • Citizen’s Watchdog group • “The Emperor has no clothes” • Music Man: Harold Hill (read Bechtel) tours the small towns (read congested areas) to sell shoddy equipment (read rail expansion systems) to clueless local school boards (read clueless local politicians.)
What is the Real Issue? • Mobility! • Because of the arbitrary “proffer” system,there is no guarantee adequate transportation improvements will happen. • Blind faith in “rail”– a 19th century technology which has proven beyond a doubt to be INEFFECTIVE in reducing surface congestion in modern cities. • “Why can’t we just all get along?”– common attitude. • Reason: $$$$$$$$
Metro a “White Elephant”pretty, but a financial drain • Thailand: White elephants were property of the sovereign (king), but couldn’t be put to work. A royal gift to anyone who displeased him. Means a financially ruinous possession that can’t be disposed of. • Phrase arrived in England in mid-18th century. Empire builders applied it to expensive but otherwise useless public buildings or monuments. These are now called “historic properties.” • Punch drew a famous cartoon applying this label to the Uganda railway. • Modern, techie term is “legacy system.”
Metrorail- A legacy system • To be maintained, but not expanded. • On books at $9 billion, would cost $20 billion to replicate. • Historical result has been to 1) reduce carpooling, 2) reduce express buses, and 3) increase single occupancy driving. • Has NOT reduced surface congestion. • Does NOT deserve a dedicated source of funding. Public sector monopolies must be held accountable every budget cycle. • Would not be built if didn’t exist already
“The White Elephant (Uganda), illustration by John Tenniel. Caption reads: “Present Proprietor: See Here, Governor: He’s a likely looking animal, but I can’t manage him… If you won’t take him, I must let him go.” This issue was whether John Bull would finance building the Uganda Railroad to Lake Victoria to hold on to the territory– which it did.
Allocation of Transportation Funds, 2005-2030: of $93 billion, transit to receive 60% of funding
WMATA Heavy Rail’s Mode share declines from 2.7% to 2% from 2005 to 2030
Freeways comprise just 6% of our total road system yet carry 45 percent of all trips. • Principal arterials comprise 6% of our road system yet carry 20% of all trips.
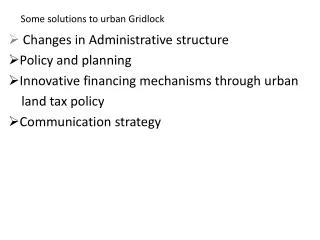
The problem: Misallocation of Transportation Funds The above graph is for the Seattle area, but it’s the same story here
New Transportation Technology starved! A Nationwide Problem. • Of nation’s 19 largest metro areas, 10 plan to allocate more than one half of their projected 20-25 year surface transportation budgets for transit capital and operating costs; 7 others plan to allocate between one-third and one-half. 17 out of 19! • Source: Federal Highway Administration, Federal Transit Administration; 2002
DC is a strange town • In addition to the too-high concentration • of pols, many are focused overseas. • Thousands of foreign policy experts, military, and private contractors struggle across the American Legion bridge between Md and Va. Each morning and each afternoon. Many are involved in the US’s spending of hundreds of billions of • taxpayer dollars to rebuild Iraq, whose capital city has more bridges across its river than does DC, all of them uncongested • At the same time, local pols will not permit the building of another river crossing to relieve the American Legion Bridge, even though it could be financed with private money
DC has a special problem.. • Three jurisdictions, including an odd one, the District of Columbia • Plus the National Government • High Number of ambitious politicians, all busy fund raising with other priorities is not a recipe for coherence • Transportation is an area where perceived competence exceeds actual understanding
Metro Matters, but not much • Originallysupposedto generate an operating profit, but now runs a 6% deficit on book value– $300,000,000 a year in operating deficits, and an equal amount in depreciation/amortization of capital costs • Metro accounting would land its managers in jail if done in the private sector • “Deferred maintenance” of $12 billion being promoted by Metro’s public relations machine
WMATA’s PR take on their predicament. The truth is that we are OVER invested in Metro and have to keep feeding the bloated beast even though it hasn’t worked well enough to justify building it in the first place.
Transit’s Market Share Insignificant– the tail that seems to be wagging the dog WMATA Rail currently handles about 600,000 trips a day. At 5.8 miles per average trip (National Transit Database), that’s about 3,500,000 passenger miles per day. Current daily Vehicle Miles in the COG study area is 126,000,000. Metrorail is 2.67% of current travel. Adding other transit modes brings the grand total up to 4%. (Source: 2002 National Transit Database).
2005-2030 Long Range Transportation Plan for DC Area To address the requirement that the plan be financially realistic, the TPB hired a consultant to conduct a study in 2003. The study projected the revenues that each state would have available for transportation through the year 2030 and compared the projected revenues to the estimated costs of maintaining and operating the current transportation system together with the expected costs of implementing the long-range plan. The total expenditures over the 25 years of the plan are equal to the total expected revenues or $93.3 billion. Overall, almost $72 billion or 77 percent of the total expenditures is for operations and preservation of the region’s transportation system. About $22 billion, or 23 percent is for expanding the transportation system. Transit expenditures are $56 billion or 60 percent of the total and highway expenditures are $37 billion or 40 percent.
Transit Share of Future Demand even smaller COG forecasts that total daily Vehicle Miles Traveled will increase 40,000,000 by 2030—126,000,000 to 166,000,000 vehicle miles per day (or 32%). Average auto occupancy is 1.13. This is then 45,200,000 passenger miles. Metrorail Miles is projected to increase 24%, or 840,000 (from 3,500,000 to 4,340,000) Metrorail is thus capturing 840,000/45,200,000 or 1.86% of new travel demand 2005-2030. The nonrail share will increase transit modal share in toto to around 3.0% of new demand. Thus, the rail share will decline to 1.86% from its current 2.67%, and overall transit share to 3.0% from its current 4.0%.
The Grim Truth…Metro really doesn’t matter Rail, at 2.67% of today’s transport mode, and below 2% of tomorrow’s mode, is too small to make any real difference. If rail shut down tomorrow, between carpooling at previous rates and express buses, life would go on pretty much the same. Even for downtown commuters. Metro would never be built again by rational people-it is a White Elephant. And it hasn’t been duplicated, either. The money would be much better invested to reduce surface congestion– such as time of day tolled express lanes, and bus rapid transit on key corridors. Congestion is much worse today than if the money that went into Metro had instead been invested in filling out our highway links– which were cancelled to pay for the White Elephant we have to keep feeding. It was an experiment that failed.
Promise Keepers (just kidding, but it’s our money) WMATA heavy rail numbers: Promotion versus Reality Projected Cost (1974): $2.98 billion Actual Cost: $9 billion ($24 billion replacement cost) Projected Daily Trips (1990): 1,300,000 Actual Trips: 600,000 Projected Income Statement: Operating Surplus after allowance for depreciation/amortization Actual Income Statement: $300 million annual cash deficit, ignoring depreciation/amortization
Public versus Private Investment • Private: • Costs are bad, revenues are not the test • Profit is the goal: a sign of good management. • Public: • Costs are good, revenues good: let’s expand the bureaucracy! • “Profit” conceptnot in lexicon • Result: With political allocation of capital, “it’s a benefits regime that distributes jobs, contracts and influence: the costs are the benefit.” -------- quote: James Dunn, Rutgers political scientist who studies transit Another illustration: Federal transportation bill reauthorization, which now contains 4,000 earmarks, almost all of which don’t appear in any state’s transportation wish list for needed improvements.
Power of Pork • Metro’s public relations empire • 18 or so lawyers • At least 180 people now on Dulles Rail payroll • $500,000 slick paid media campaign to “sell” toll increases • More money spent on study and design of extension than spent to build original Toll Road, even adjusted for inflation- around $80 million. • A few percent of this “consulting” money finds its way back into the campaigns chests of local pols: Cliff Slater’s study in Honolulu says about 3% on average.
Dulles Rail? • Current cost is $4 billion for 20 miles, or $200 million per mile • Adding a pair of lanes to Toll Road (10 miles) would run about $100 million, and provide greater capacity • Tysons better served with loop connecting to West Falls Church via straight (Route 7) routing– one of the few people-moving opportunities in the U.S. outside of airports.
The “Promise” of Dulles Rail • Increase in modal share of passenger miles in Fairfax County from 1% overall to 2% • No congestion relief on any road in Northern Virginia • No affect on faster growing outlying counties of Prince William, Loudoun, Stafford • $100 million a year increase in tolls on the Toll Road • Subsidies per new rider equal to gross annual income of poorest 30% of Fairfax County Residents
More Dulles Rail “Promises” • Spillover of failed freeways onto local arterials such as Rt 123, Lewinsville, 7 • Depletion of highway budget: Dulles Rail will cost more than Springfield Bypass/Wilson Bridge put together • Will guarantee failure of ETL (HOT) lanes on I-495 (Reason: no place for express traffic to merge onto Dulles Toll Road). • Bottom Line: I-66 level performance, only with ever escalating tolls. • Obviously, this “vision” is a disaster.
Monopoly transit agency pursues “choice” suburban rail riders by ignoring their base- San Francisco BART version Dateline, May 2005:Low-income residents of Oakland are suing the Metropolitan Transportation Commission, charging discrimination because the commission gives most available funds to rail transit to affluent white neighborhoods while bus transit in poor minority neighborhoods are starved for funds. The Metropolitan Transportation Commission (MTC) is the regional organization that distributes federal transportation funds to Bay Area transit and highway agencies. The suit points out that MTC's regional transportation plan failed to provide $700,000 for bus transit improvements in a black neighborhood, but it did fund $1.5 billion for commuter trains and $4 billion for a BART extension to San Jose. MTC's own analysis said that the unfunded bus service would have added new passengers at a cost of just 75 cents a ride, while the commuter trains would cost $26 per new ride and the BART extension would cost up to $100 per new ride. [JUST LIKE DULLES RAIL]
Would any megaproject be undertaken if some form of delusion were not involved, that is, would projects be undertaken if the true costs and benefits were known beforehand? Project promoters appear to think delusion is necessary to get projects started and they effectively produce deceptive forecasts… Martin Wachs interviewed public officials, consultants, and planners who had been involved in transit planning cases in the U.S. He found that a pattern of highly misleading forecasts of costs and patronage could not be explained by technical issues and were best explained by lying. In case after case, planners, engineers and economists told Wachs that they had had to “cook” forecasts in order to produce numbers that would satisfy their superiors and get projects started, whether or not the numbers could be justified on technical grounds.
…WE find with a very high level of significance that rail passenger forecasts are more biased (inflated) than road vehicle forecasts.” …We conclude that the traffic estimates used in decision making for rail infrastructure development are highly, systematically and significantly misleading. Rail passenger traffic forecasts are consistently and significantly inflated. For road projects the problem of misleading forecasts is less severe and less one-sided than for rail.
Core Issue • Why should the average, poorer taxpayer be subsidizing a richer commuter traveling to a higher paying job outside the jurisdiction where he/she lives? • This issue was litigated in Los Angeles, where the transit agencywanted to cancel bus service and force use of rail: it was demonstrated that this procedure, which WMATA subscribes to, discriminated against the poorer bus riders. • In Denver, with the “fast track” light rail proposal on the ballot, the no-growthers questioned whether subsidized transit would encourage “sprawl.”
Upper Class welfare: The poor subsidizing the rich • The average subsidy to a new rider on Dulles Rail exceeds the per-capital income of the lower 30% of the population of Loudoun/Fairfax Counties • New Rail Rider much better off than motorists subsidizing the operation at the Toll Plazas • Very expensive to pull suburbanites out of their cars: these are so-called “choice customers” for the transit agencies. • MUCH cheaper to give each new rider a brand new Lexus.
“Worst of all Worlds” scenario • By 2025, Tysons/Dulles Corridor will have the unique disadvantage of: • Highest property taxes in Virginia (special tax district) • Only full-time tolled freeway in area • Service Level “F” (failure) on every major freeway/arterial • Like I-66, only with full time tolls • Beltway even worse than today
Sign Entering Tysons from McLean: (Courtesy the Taxpayers League of Minnesota)
Dulles Rail- NO Congestion Relief! Source: Dulles Rail EIS, table 6.2-1
Toll Road Relief? • Heavy rail typically relieves 1 ½ years of traffic growth on adjoining corridor. • Dulles Corridor, about 150,000 cars per day; rail will offload about 6,000 cars • But we are paying for rail with higher tolls and subsidies for the rest of our lives • This makes no sense