ESSE Environmental Scenario Search Engine for the Data Services Grid
300 likes | 494 Views
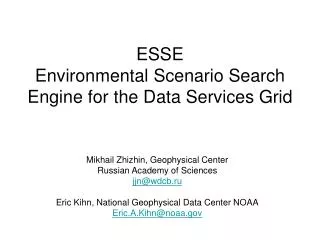
ESSE Environmental Scenario Search Engine for the Data Services Grid. Mikhail Zhizhin , Geophysical Center Russian Academy of Sciences jjn@wdcb.ru Eric Kihn, National Geophysical Data Center NOAA Eric.A.Kihn@noaa.gov. www.wdcb.ru. Geophysical Center Russian Academy of Sciences

ESSE Environmental Scenario Search Engine for the Data Services Grid
E N D
Presentation Transcript
ESSEEnvironmental Scenario Search Engine for the Data Services Grid Mikhail Zhizhin, Geophysical Center Russian Academy of Sciences jjn@wdcb.ru Eric Kihn, National Geophysical Data Center NOAA Eric.A.Kihn@noaa.gov
www.wdcb.ru • Geophysical Center Russian Academy of Sciences • World Data Centers for Solid Earth and Solar-Terrestrial Physics • Environmental data archives – paper, tapes, files, databases, e-journals… • International network for geophysical data exchange with theUS, Japan, China, … • Computer center, Linux cluster, fiber optics • Part of the EuropeanGRID infrastructure EGEE, Russian GRID Virtual Organizatione-Earth
50 years ago – International Geophysical Year – IGY1957 Total data volume~ 1 Gb Exchange~ 1 Mb/year
Yesterday – databases, Internet, web – Y2K Total data volume~ 1 Tb Exchange~ 1 Gb/year
Tomorrow – ElectronicGeophysical Year – EGY2007 Total data volume~ 1 Pb Exchange~ 1 Tb/year
SPIDR – Space Physics Interactive Data Resource Kamchatka Moscow Nagoya Boulder Beijing SPIDR 3 SPIDR 2 Grahamstown Sydney http://spidr.ngdc.noaa.gov
Cross-disciplinary data exchange • Users need datafrom different disciplines • Rapid growth of the data volume and data demand requires new tools forthe data management and the data mining
“Metcalfe’s law” for databases • The utility ofN independent data sets seems to increase super-linearly • One can find N(N-1) ≈ N2 relations between data sources, that is their utility grows≈ N2 • It is more efficient ot use several data sources than one archive
Sources of data inflation? • New versions • Derived data products • Reanalysis Products ofLevel 1 (NASA terminology) take 10% of the Level 0 volume, but the number of the Level 1 products is increasing. If the volume of the Level 0 data grows as N, then the volume of Level 1 data is growing as N2.
Observations + Model = Reanalysis • Direct observations, including raw and processed data, e.g. meteorological station orsatellite. • Numerical model “knows” physics, uses direct observations as boundary values, e.g. Global Circulation Model. Input data volume (irregular grid) is less than the output volume (regular grid). • Reanalysis – accumulated output of the numerical model runsbased on the direct observations for a long time period, say 50 years.
D-day reanalysis – morning (after ECMWF) June 6th, 1944, midnight June 6th, 1944, 6 AM
D-day reanalysis – evening(after ECMWF) June 6th, 1944, 12 AM June 6th, 1944, 6 PM
Data inflation after reanalysis • Modern global atmospheric circulation model (GCM) at 2.5o (latitude) x 2.5o (longitude) x 20 (levels) = 106 gridpoints. • GCM outputs "high-frequency" data every six hours of simulation time, so~ 1 Gb of data per simulation day . • By contrast, the world-wide daily meteorological observational data collected over the Global Telecommunications System, is ~ 200 Mb. • As an extreme, to runthe GCM for 50 years of simulation time will provide40 Tb of data.
Space Weather Reanalysis Input: ground and satellite data fromSPIDR Space weather numerical models Output: high-resolution representation of the near-Earth space
ESSE solutions • Do not use data files, use distributed databases • Optimize data model for the typical data request • Virtualize data sources using grid (web) services • Metadata schema describes parameters, grids, formulas for virtual parameters (e.g., wind speed fromU-and V-wind) • Search for events in the environment by the “scenario” in natural language terms • Translate the scenario into the parallel request to the databases using fuzzy logic
ESSE architecture • Fuzzy logic engine performs searching and statistical analysis of the distribution of the identified events • Parallel mining of several distributed data sources, possibly from different subject areas • Both the fuzzy logic engine and data sources implemented as Grid (web) services • Interfaces and data structures can be obtained from the definitions of the web-services (WSDL) • Web services and prototype user interface are installed on two mirror servers: • Boulder, US • Moscow, Russia
ESSE “time series” data model Indexed lat-lon grids of time series in BLOBs
What is fuzzy logic? • Fuzzy logic uses set membership values between and including 0 and 1, allowing for partial membership in a set. • Fuzzy logic is convenient for representing human linguistic terms and imprecise concepts (“slightly”, “quite”, “very”). Fuzzy membership functions
What good is fuzzy logic for ESSE? • Fuzzy engine allows to build queries in human linguistic terms: (VERY LARGE “wind speed") AND (AVERAGE "surface temperature") AND (“relative humidity“ ABOUT 60%) • You can use the same terms for different value ranges: AVERAGE TEMPERATURE for Africais not the same asfor Syberia. • Results are given as a list of “most likely” events. Each event is assigned a value, representing its “likeliness”.
“High” Wind “Average” Temperature “About” 60% Humidity
Prototype workflow and UI • Prototype UI implemented as a web-application • Discover data sources by keyword-based metadata search • Use predefined weather events (e.g. “ice storm”, “flood”) • Define the event as a combination of fuzzy conditions on a set of environmental parameters (e.g. “high temperature and low relative humidity”) • Review statistics for the detected events • Visualize the selected event as time series plots or contour maps • Download the event data in self-describing format (NetCDF or HDF) to the user’s workstation
Setting spatial locations Select a set of "probes" (representing spatial locations of interest, e.g. New York) where the desired event may occur.
Defining fuzzy search criteria • Select several parameters for the event from a list.Set the fuzzy constraints on the parameters for the event (e.g. “very high temperature”, “very high humidity”).
Working with scenarios The user may search for a desired scenario by describing several subsequent events
Search Results • “Score” represents the “likeliness” of each event in a numerical form. • The results page provides links to visualization and data export pages.
What do we get at the end? • Using the“time machine”, we can see the weather on the D-day, or the Rita hurricane, or the typical September day in San Diego. • Statistics to estimate risk from natural disasters, global climate change, realistic weather in movies, computer games, simulators • When Tim Berners-Leeuses semantic web to find a photo of the Eiffel Tower on a sunny summer day, ESSE can provide a list of sunny days to be merged with the list of images named with “eiffel”