Download
1 / 17
170 likes | 356 Views
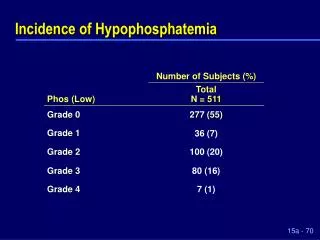
Comparison of worldwide First-ever-in-a-lifetime (FES) stroke incidence risk: implications for current and future stroke incidence Syme, P.D., Byrne, A., Chen, R., Finlayson, A. Aims To determine the contribution of stroke incidence risk to crude incidence Methods

E N D
Comparison of worldwide First-ever-in-a-lifetime (FES) stroke incidence risk: implications for current and future stroke incidenceSyme, P.D., Byrne, A., Chen, R., Finlayson, A.
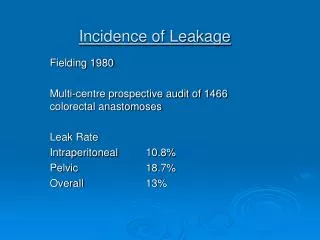
Aims To determine the contribution of stroke incidence risk to crude incidence Methods 18 worldwide incidence studies were compared with the Scottish Borders stroke study (SBSS) Studies were selected if they fulfilled “ideal” incidence criteria and data was available on first-ever stroke (FES) numbers, the population denominator for each age group and the study duration
Methods cont. Logistic regression was used along with age standardisation to estimate risk An SBSS crude incidence prediction model was developed The SBSS model was tested on the Scottish National dataset (110,000,000 person years of risk) for FES and admissions. The model was then tested on Australian National dataset for stroke admissions
Comparison of age standardisation and odds ratio estimation of age-adjusted risk Residuals (Age-adjusted incidence risk)
Worldwide risk of stroke (all ages) SBSS NW England * Dijon London * UK studies * ESPRO All UK Fredericksberg Arcadia Tees * Aukland Study SEPIVAC NEMESIS * OCSP Perth Rochester Belluno Inherred Valle D'Aosta Soderhamn Novosibirsk .4 .6 .8 1.0 1.2 1.4 1.6 1.8 Age and sex-adjusted Odds Ratio (95% CI)
Worldwide risk of stroke in < 65 years old SBSS Dijon * NWEngland * UK studies Inherred All UK<65 ESPRO Vallle D'Aosta Arcadia * London Aukland Study * OCSP Perth Fredericksberg Soderhamn SEPIVAC * Tees Belluno NEMESIS Rochester Novosibirsk 0.0 .5 1.0 1.5 2.0 2.5 3.0 Age and sex-adjusted Odds Ratio (95% CI)
Worldwide incidence risk crude incidence (n/10000) F Odds ratio (OR) F Odds ratio <65 % aged 65 years and over 60 F 2 1.8 50 1.6 F 1.4 40 F F 1.2 F (n/10000) F F F OR F 30 1 F F F F F F F F F F F F F F F F F F F F 0.8 F F F F F F 20 0.6 F F F 0.4 10 0.2 0 0 Dijon Tees Perth Novo ESPro SBSS OCSP d'Aosta NWEng Arcadia London Belluno Auck 81 Fred 89- Innherre Roc 85-8 Sod 89-9 SEPIVAC NEMESIS World incidence studies
60 1.6 F 1.4 F 50 F F 1.2 F F F 40 F F F F 1 F F F F F F F F F F F (n/10000) F F F F F F OR F F F 30 0.8 F F F F F F 0.6 20 0.4 F 10 0.2 0 0 Dijon Tees Novo Perth ESPro SBSS OCPS d'Aosta NWEng Belluno Arcadia London Auck 81 Fred 89- Innherre Roc 85-8 Sod 89-9 NEMESIS SEPIVAC World incidence studies Worldwide incidence risk crude incidence (n/10000) F Odds ratio (OR) F Odds ratio 65 years and over % aged 65 years and over
Odds ratio estimation of age-adjusted risk Residuals (Age-adjusted incidence risk) Odds ratios
Scottish First-ever strokes (SMR1) from 1981- 2000 Western Is Scottish First-ever stroke 1981-2000 Tayside 3000 Lothian Lanark 2000 Glas Gramp Scottish First-ever stroke (n) Forth V 1000 Fife D & G 0 Bord A & A -1000 A & C 8 10 12 14 16 18 percentage of the population >= 65 years old
SBSS estimation of first-ever stroke(SMR1 returns 1981-2000) Western Is Tayside Lothian Lanark Glas First-ever stroke numbers (n) Gramp Forth V Fife D & G Bord A & A A & C Rsq=0.97
Scottish stroke admissions (SMR1) from 1981- 2000 Western Is Scottish Stroke Admissions 1981-2000 Tayside 5000 Lothian 4000 Lanark Glas 3000 Gramp Scottish Stroke Admissions (n) Forth V 2000 Fife 1000 D & G Bord 0 A & A -1000 A & C 8 10 12 14 16 18 percentage of the population >= 65 years old
SBSS estimation of admissions(SMR1 returns 1981-2000) Western Is 4000 Tayside Lothian Lanark 3000 Glas Scottish Stroke Admissions (n) Gramp 2000 Forth V Fife D & G 1000 Bord A & A A & C 0 0 1000 2000 3000 Rsq= 0.97 SBSS estimated First-ever stroke
SBSS FES model tested on Australian stroke admissions for 1999 Australian cerebrovascular admissions 14000 NT 12000 ACT 10000 Tas SA 8000 Australian Stroke Admissions (n) WA 6000 Qld Vic 4000 NSW 2000 Total Population 0 Rsq = 0.9912 0 2000 4000 6000 8000 10000 12000 SBSS estimated First-ever stroke
Conclusions • We have demonstrated significant differences in age-adjusted stroke incidence risk worldwide • Incidence risk has not declined over the last 20 years of incidence studies • For most populations, crude incidence can be accurately estimated by age-dependent incidence • We predict a massive increase in stroke incidence over the next 50 years due to population ageing