Download
1 / 54
550 likes | 705 Views
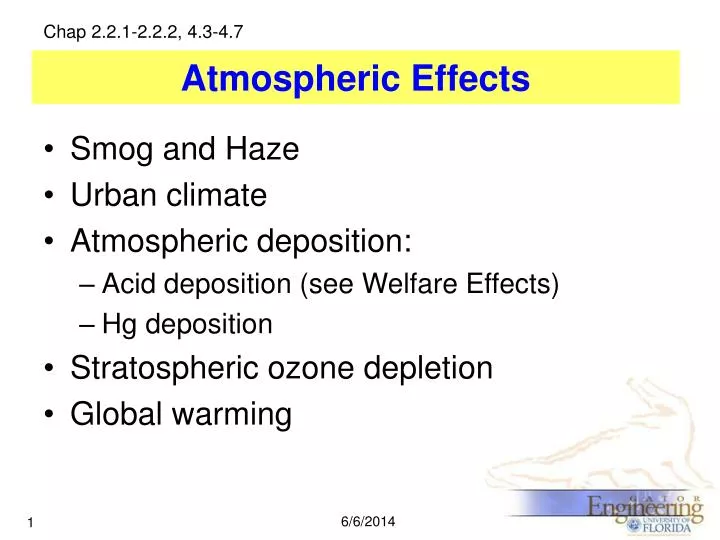
Chap 2.2.1-2.2.2, 4.3-4.7. Atmospheric Effects. Smog and Haze Urban climate Atmospheric deposition: Acid deposition (see Welfare Effects) Hg deposition Stratospheric ozone depletion Global warming. Originate from the unpleasant combination of smoke from coal combustion and fog

E N D
Chap 2.2.1-2.2.2, 4.3-4.7 Atmospheric Effects • Smog and Haze • Urban climate • Atmospheric deposition: • Acid deposition (see Welfare Effects) • Hg deposition • Stratospheric ozone depletion • Global warming
Originate from the unpleasant combination of smoke from coal combustion and fog First episode: SO2 smog during industrial revolution (London-type smog). Also called “gray smog”. Nowadays, broadly applied to atmospheric pollution conditions characterized by a significant reduction in visibility. More commonly present nowadays is photochemical smog, mainly ozone What are the important parameters in determining O3 level? Smog
What will be your strategy to reduce LA-type/O3 formation, if you are an EPA administer? Los Angeles-type Smog • Is exacerbated by • Large number of sunny days • Large population of motor vehicles • Topographical limitations on air flow • Frequent subsidence inversions • Due to the presence of NO2, LA-type smog is brown • Is also a problem in Houston, Denver, Mexico City
Haze • Moderate visibility reduction associated with atmospheric pollutants (mainly SOx emission) • Common in many American/European cities: e.g. in Midwest, Northeast and Southeast • Broad regional distribution • Can be seen by satellites Smoky Mountains Clear DaysHazy days
Haze in US Midwest Southeast (e.g. FL) http://www.nasa.gov/vision/earth/environment/New_IDEA_Air_Quality_Monitoring.html http://www.gulfcoast-homes.com/images/palm_island.jpg Minneapolis Northeast http://news.minnesota.publicradio.org/features/2005/02/02_bensonl_badairday/ earthobservatory.nasa.gov
http://www.signonsandiego.com/news/world/20061008-0850-southeastasia-haze.htmlhttp://www.signonsandiego.com/news/world/20061008-0850-southeastasia-haze.html http://www.iribnews.ir/Full_en.asp?news_id=219535&n=33 www.ens-newswire.com/.../2002-11-08-06.asp http://www.mir.com.my/rb/photography/windows/htmls/htmls/vincent2.htm Haze in Southeast Asia • Expands over dozens of countries • Forest fire
Glen Canyon NRA www.lakepowell.net/asiandust.htm Pristine Air • Good visibility in areas of high air quality (visual range of 60 – 100 miles) • Characteristic of West and Southwest • Concern related to areas around national parks (e.g. Grand Canyon), monuments, and wilderness areas • Plume blight a major concern; power plant emissions affect visibility for tens of kms • Reduction in the distinctness of land forms and vistas www.lakepowell.net/asiandust.htm
Arctic Haze • Reported initially in 1950s over Barrow, Alaska • Has intensified over the past 40 years • Covers a linear expanse of 800 to 1300 km • Occurs at altitude’s below 9 km • Maximum intensity at approximately 4-5 km • Results from pollutant transport from Siberia and northern Europe • Causal pollutants- SOx and elemental carbon • Sulfate concentrations 10 to 20 times background levels • Exacerbated by • Inefficient pollutant removal processes • Very steep inversion layer www.terradaily.com/reports/Haze_Is_Heating_Up... www.gi.alaska.edu/ScienceForum/ASF9/948.html
Thermal Air Pollution • Effect can be seen as a heat island at night • Sources • Waste heat from energy-utilizing processes • Absorption of sunlight and energy storage of urban surfaces • Reduced urban ventilation due to surface roughness Heat Island Map of New York City www.atmosphere.mpg.de/enid/3rl.html
How does it vary daily, weekly and yearly? How will it influence weather and climate? Urban Heat Island • New York City - anthropogenic heat 2.5 times that received from the sun in winter, in summer 17 % of total city energy budget • In many cities 10 % of energy received from the sun • Major Factors influencing UHI: • Population • Size and spatial structure • Meteorology www.atmosphere.mpg.de/enid/3rl.html
Nocturnal Air Circulation • Similar to a sea breeze on an island • Result in “dust dome”
Does it increase or decrease precipitation? Droplets coalesce Water vapor condensation on nuclei Precipitate If there a lot of CCNs, how does that affect droplet size? How will that affect precipitation? If there a lot of giant nuclei (> 1 um), how does that affect droplet size? How will that affect precipitation? Effects on Precipitation • Particles serve as sites for condensation • A fraction of particles serve as weather-active cloud condensation nuclei (CCN) • Concentration of CCNs determines initial size and number of water droplets http://earthsci.org/processes/weather/weaimages/ccprcess.gif
http://www.dnr.state.wi.us What’s the largest anthropogenic source? Mercury Deposition Why is Mercury of great concern? How is it different from other major pollutants (e.g. SO2, O3)? • Accumulation in aquatic ecosystems • Bioaccumulation in food chains • Fish advisories • Anthropogenic sources account for 75 % of emissions to the atmosphere • Chemistry affects movement • Elemental Hgo environmentally mobile • Divalent Hg++ typically bound to particles • Emissions are in the form of Hgo, Hg++, and particle bound Hg
Florida Panther Hg0 Hg2+ CH3Hg http://www.florida-keys.fl.us/images/apanther.gif Mercury Deposition • Hg++ most common form of mercury in surface waters; however, atmospheric Hg is the major source of Hg loading to aquatic ecosystems • Hg++ transformed to CH3Hg by microorganisms • Methyl mercury tends to remain in water • When converted to Hgo emitted to the atmosphere • Mercury can be transformed from one form to another over and over again • Transformations result in a environmental movement; it ceases when deposited at high latitudes/high altitudes
Which region has the higher concentration? Why is S. Florida high? Why advisory along coastline?
Mercury Regulations • 1990 CAAA: list Hg as one of the 188 Hazardous Air Pollutants • 2005: Clean Air Mercury Rule (CAMR) to cap Hg emissions from coal-fired power plants: • Phase 1 (2010) caps the emission to 38 ton/yr. Emissions will be reduced by taking advantage of co-benefit reductions – that is, mercury reductions achieved by reducing sulfur dioxide (SO2) and nitrogen oxides (NOx) emissions under CAIR. • Phase 2 (2018) caps the emission to 15 ton/yr. • 2005: Clean Air Interstate Rule (CAIR) to reduce air pollution that moves across state boundaries: • 2015: reduces 70% SO2 and 60% NOx from the 2003 level for 28 eastern states and DC.
What species can cause O3 destruction? Crutzen Rowland Molina www.norbelprize.org Stratospheric O3 Depletion • History of concern • Supersonic transports (NOx) and nuclear weapons testing (NOx) • Chlorofluorocarbons (Cl): Paul Crutzen, Sherwood Rowland and Mario Molina, 1995 Nobel Chemistry Laureates • Nitrous oxide (N2O) release from fertilizer • Polar stratospheric clouds (PSCs)
Ozone Layer Dynamics • Natural formation and destruction of O3 in the stratosphere (Chapman cycle)
Ozone Layer Dynamics www.ccpo.odu.edu/.../class/Chap_5/5_thumbs.htm
Is it safe once HNO3 is formed? Role of NOx • A threat to the O3 layer • Direct emissions from SSTs, nuclear weapons testing • Nitric oxide can catalytically destroy O3 • More possibly through destruction of nitrous oxide (N2O) that is stable in the troposphere • Major sink
Role of Halogenated Hydrocarbons • Chorofluorocarbons, Chlorinated hydrocarbons, Halons • In the upper and middle stratosphere, Cl is produced from destruction of CFC by photolysis • These reactions and others can result in the destruction of 100,000 O3 molecules by 1 Cl before being removed from the stratosphere • In the lower stratosphere
Can other halogens do the same harm? Bromine Cycle • Similar to Cl cycle; responsible for approximately 20 to 25 % of O3 loss at altitudes of 16 to 20 km • BrO-ClO cycles are interconnected; account for ~20-25% of O3 loss at altitudes of 16-20 km
Sink Processes for Cl and Br • Reactions that produce HCl, HBr, chlorine nitrate, and Bromine nitrate • HCl and ClONO2 are temporary Cl reservoirs - Cl is regenerated • Bromine is similarly regenerated
Antarctic O3 Hole • British scientists conducting ground-based column O3 measurements in Antarctica in 1985 observed a dramatic decline in austral spring O3 levels • Re-evaluated satellite data showed that the phenomenon started as early as 1975 • Progressive increase in the geographical area involved and continued decrease in column O3 levels into the 1990s
Why in springtime? Changes in Antarctic O3 levels http://www.atm.ch.cam.ac.uk/tour/
Chemistry of Antarctic O3 hole • Ozone destruction results from heterogeneous-phase chemistry involving • Polar stratospheric clouds (PSCs) • HCl, ClONO2, Cl2, HOCl • PSCs • Type1 • Large quantities of nitric acid and water • May also contain sulfuric acid • Particles range from 0.1-5 m • Type 2 • Consists mostly of water • Particles are large 5-50 m • Absorbs sink substances such as HCl, ClONO2, HOCl, and N2O5
Mt. Pinatubo Does sulfate play a role? http://www.timjacobs.com/images/Philippines/Pinatubo/Volcano8.jpg Why do we care if stratospheric ozone is depleted? Stratospheric Sulfate Aerosol (SSA) • Produced from volcanic eruptions • Produce surfaces for heterogeneous- phase chemistry • Serve as PSC formation nuclei Ozone Depletion Trends • Occurs at high and mid latitudes • Rate of depletion over mid latitudes has slowed in 1990s • Total O3- destroying substances have been declining in troposphere since 1994
Ozone Depletion Effects • Cooling of lower stratosphere since 1980 • -0.6oC/decade from 1979 – 1994 • Changes in surface UV radiation because O3 is responsible for absorbing 99% of UV less then 320 nm • UV-A (320-400 nm) • UV-B (280-320 nm) • UV-B exposure may cause • Sunburn • Cataracts • Skin cancer • Common • Melanoma • Increased UV-B, increase skin cancer rates in Caucasians
Ozone Depletion Potential (ODP) • A number that refers to the amount of ozone depletion caused by a substance; the ratio of the impact on ozone of a chemical compared to the impact of a similar mass of CFC-11 • Class I Substance: chemicals with an ODP of 0.2 • Class II Substance: ODP of <0.2 http://www.epa.gov/ozone/ods.html
Climate in Florida? New England? Arizona? Global Warming • Climate and climate change • Weather - day to day atmospheric changes • Climate - average atmospheric conditions • Less variable than weather • Changes over time • Viewed in the context of geographical regions • Can also be viewed in the global context What are the primary factors that determine climate? • Energy received from the sun • Earth’s albedo (reflection back to space) • Absorption of incoming solar radiation and absorption of outgoing thermal radiation
Orbital Changes and Climatic Variations Is global warming a natural phenomenon? • Obliquity: Tilting of the Earth’s axis • Varies from 22.1-24.5 degrees • Complete cycle 41,000 years • Responsible for changes in seasons • Precession: Earth wobbles on its axis • Describes a circle among the stars • Cycle is 20,000 years • Effects when summer and winter occur • Eccentricity: Nature of Earth’s orbit (which is elliptical) around the sun changes • Periodicity of 100,000 years • Changes distribution of solar energy
Orbital Changes and Climatic Variations Variations in Solar Radiation • Do not increase or decrease the amount of solar energy received by the Earth; only determine how it is distributed over the surface and contrast between season. • Linked to cycles of glaciation (Milankovitch cycles) • Periods of significant global surface cooling 20,000, 40,000, and 100,000 years • “Pacemakers”of ice ages • The amount of solar radiation received is a constant • 1370 W/m2/sec • Short-term changes related to sunspot (dark, relatively cool regions on the sun) cycles • Peak to peak variation during sunspot cycle = 0.08 % • Little Ice Age -14 to 19th century
Greenhouse Effect and Global Warming • Allowing incoming solar radiant energy (short wavelengths) to penetrate to the earth’s surface while re-absorbing infrared radiation emanating from it. Greenhouse Gases • Primary • CO2, water vapor • Other • CH4, N2O, Tropospheric O3, CFCs, perfluorocarbons, sulfur hexafluoride
What’s the appropriate concentration? Venus Mars Earth Surface temp. 726 K 97% CO2 Surface temp. 281 K Surface temp. 200 K
Changes in Atmospheric CO2 Concentration Mauna Loa, HI Antarctica Ice Core http://www.planktos.com/educational/images/CO2.gif http://www.worldclimatereport.com/.../co2growth1.JPG
Changes in Atmospheric CH4 Concentration Data from ice cores obtained from Law Dome, Antarctica and archived air samples Cape Grim. Methane concentration appeared to be rising quickly – over 10% in the decade 1980-90!
Figure 1.5 Greenhouse Gases • Emissivity • Ability of the atmosphere to emit thermal energy to space • Varies across the infrared spectrum • Atmospheric window CH4, N2O, CFCs
Radiative Forcing • Net radiative energy available to the earth’s atmosphere • Positive - warms the earth • Negative - cools the earth Sulfate aerosol resulting from the eruption of Mt. Pinatubo, Philippine • Greenhouse gases cause positive forcing and climatic warming • Aerosols • Sulfate? • Soot (elemental carbon)? visibleearth.nasa.gov/Atmosphere/Aerosols/Sulfate_Particles.html
Which species is more influential? Radiative Effectiveness/Global Warming Potential • Radiative Effectiveness: Ability to absorb thermal energy relative to CO2 • Global Warming Potential (GWP): depends upon the absorption spectrum of the gas and the emission spectrum of the earth.
Radiative Forcing Associated with Greenhouse Gases • 2.43 W/m2 since 18th century • 1.46 to CO2 • 0.48 to CH4 • 0.34 to halocarbons • 0.15 to N2O • 0.35 to tropospheric O3 • -0.3 to -1.0 to sulfate aerosols • 0.2-0.8 to elemental carbon
http://zfacts.com/metaPage/lib/zFacts-global-temperature-1860-2005.gifhttp://zfacts.com/metaPage/lib/zFacts-global-temperature-1860-2005.gif Evidence for Climate Change • Increases in global surface temperatures • Increases in average nighttime minimum temperatures(~0.2o C/decade) • Increase in ocean surface temperatures (~0.05oC/decade)
Evidence for Climate Change • Increase in annual land precipitation in mid to high latitudes in northern hemisphere • Increasing humidity over the northern hemisphere in the past quarter-century • Increases in cloud cover over mid to high latitude continental areas in northern hemisphere • Sea level changes of 10 to 20 cm over the past century • Decreasing snow cover and land ice • Retreat of glaciers • Decrease in Arctic sea ice • Biological changes sofia.usgs.gov/.../coastal/flbay/decline.html
Climate Models • Mathematical equations based on physical laws • Predict changes in response to perturbations such as • Increases in one or more greenhouse gases • Increases in solar radiation • Increases in albedo • Undergoing continued development and refinement • Include sub-models of the atmosphere, oceans, land surface, cryosphere, and the biosphere • Simulate climate down to sub-continental scales and temporal scales from seasons to decades • Clouds/humidity changes are sources of uncertainty • Good track record in reproducing warming trends in 20th century driven by greenhouse gases and sulfates
What affects the accuracy of model prediction? Future Predictions http://www.globalwarmingart.com/wiki/Predictions_of_Future_Change_Gallery